These signals are typically analysed independently.
If contribution and dependence are analysed separately, can they explain behaviour under missing modalities?
Modality Contribution
Average marginal utility across modality subsets
Estimated via MM-SHAP
Modality Dependence
Effect of removing a modality
Estimated via ablation
RQ1 — Modality Absence and Behavioural Degradation
RQ1 — Modality Absence and Behavioural DegradationRQ1
Research question
How and to what extent does model performance change when an entire modality is unavailable at inference time, and how reliably can this change be anticipated?
— Under Review with TBD
Sub-questions
RQ1.1
How closely do MM-SHAP contributions align with accuracy drop, confidence change, and calibration shift once the modality is gone?
RQ1.2
Does Gaussian noise masking improve, worsen, or leave unchanged the baseline drop observed with zero masking?
RQ1.3
Can validation-time indicators or MM-SHAP contributions predict a model's dependence on a modality before removal?
Approach
Systematic modality ablation across datasets and modelsInterpretable Signals vs. Effective Utility
Comparison of attribution and observed behavioural changes; evaluation of masking strategies (zero and Gaussian noise)Representing Missingness: Zero-Masking vs Gaussian Noise
Tracking training-time modality dependence against validation behaviourTraining Dynamics and Early Indicators
RQ1.1
RQ1 — Modality Absence and Behavioural DegradationRQ1.1 Results
RQ1.1 — Attribution vs dependence
MM-SHAP contributions do not consistently reflect functional dependence under modality removal.
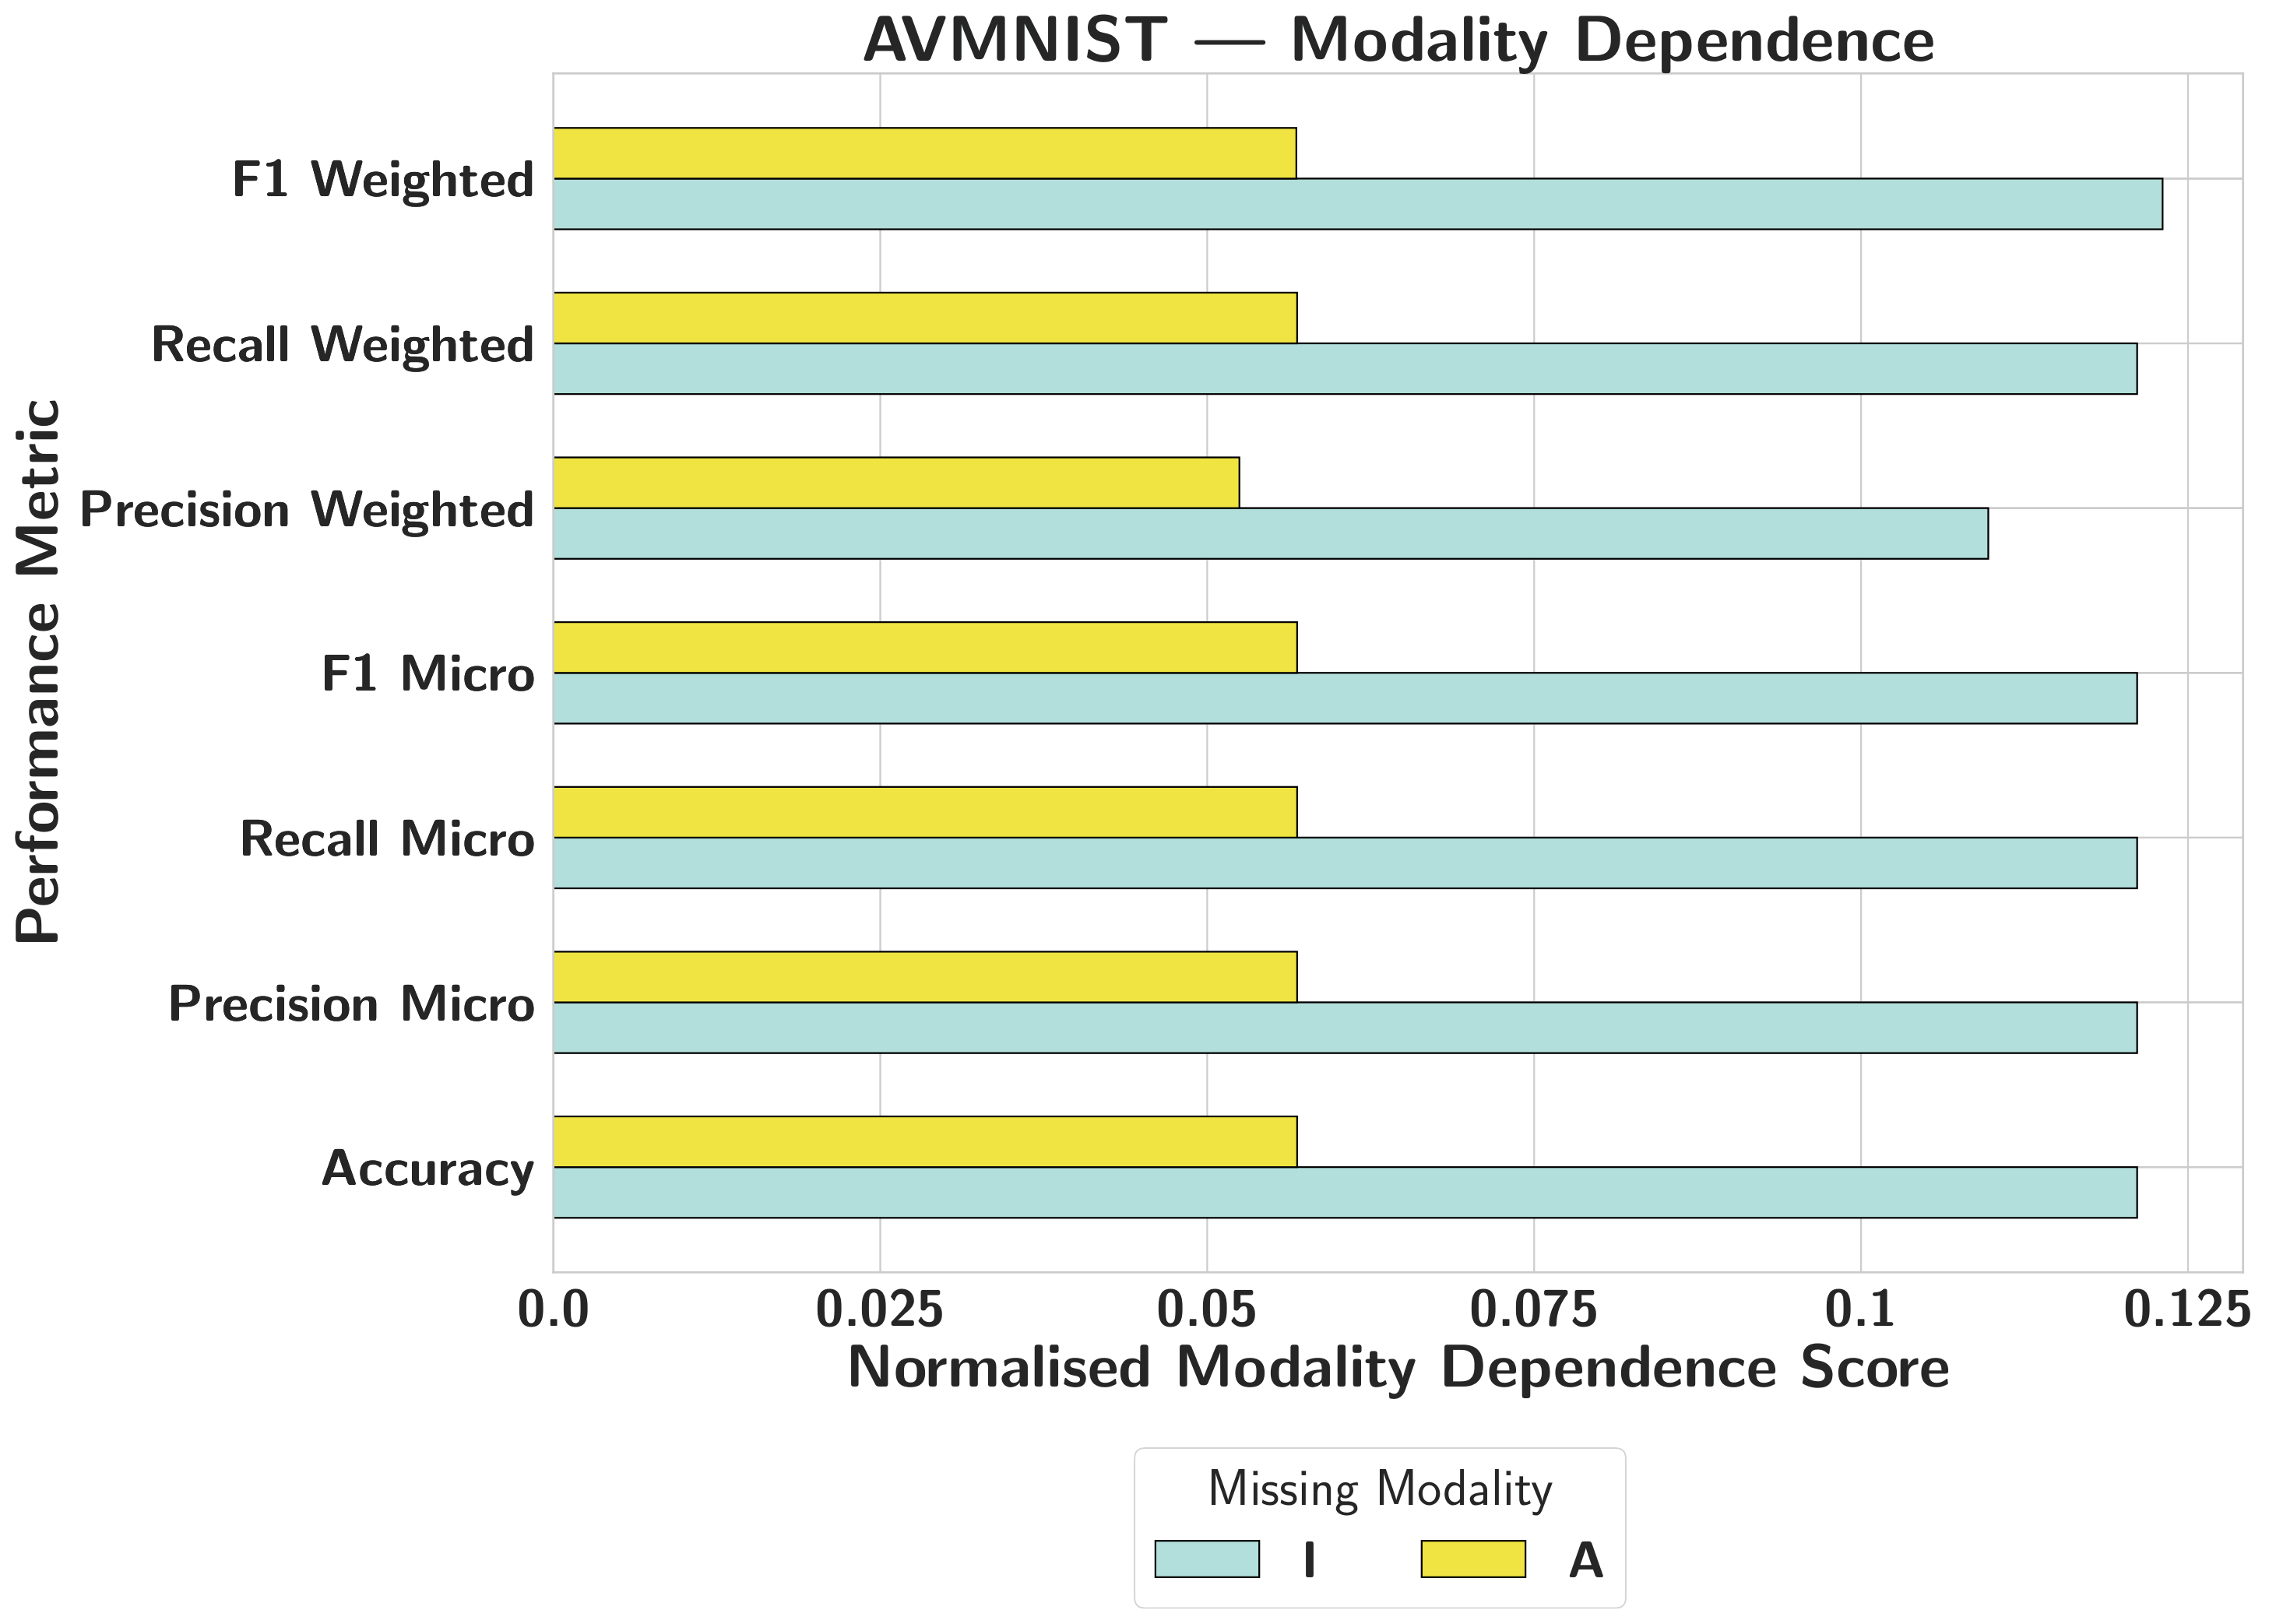
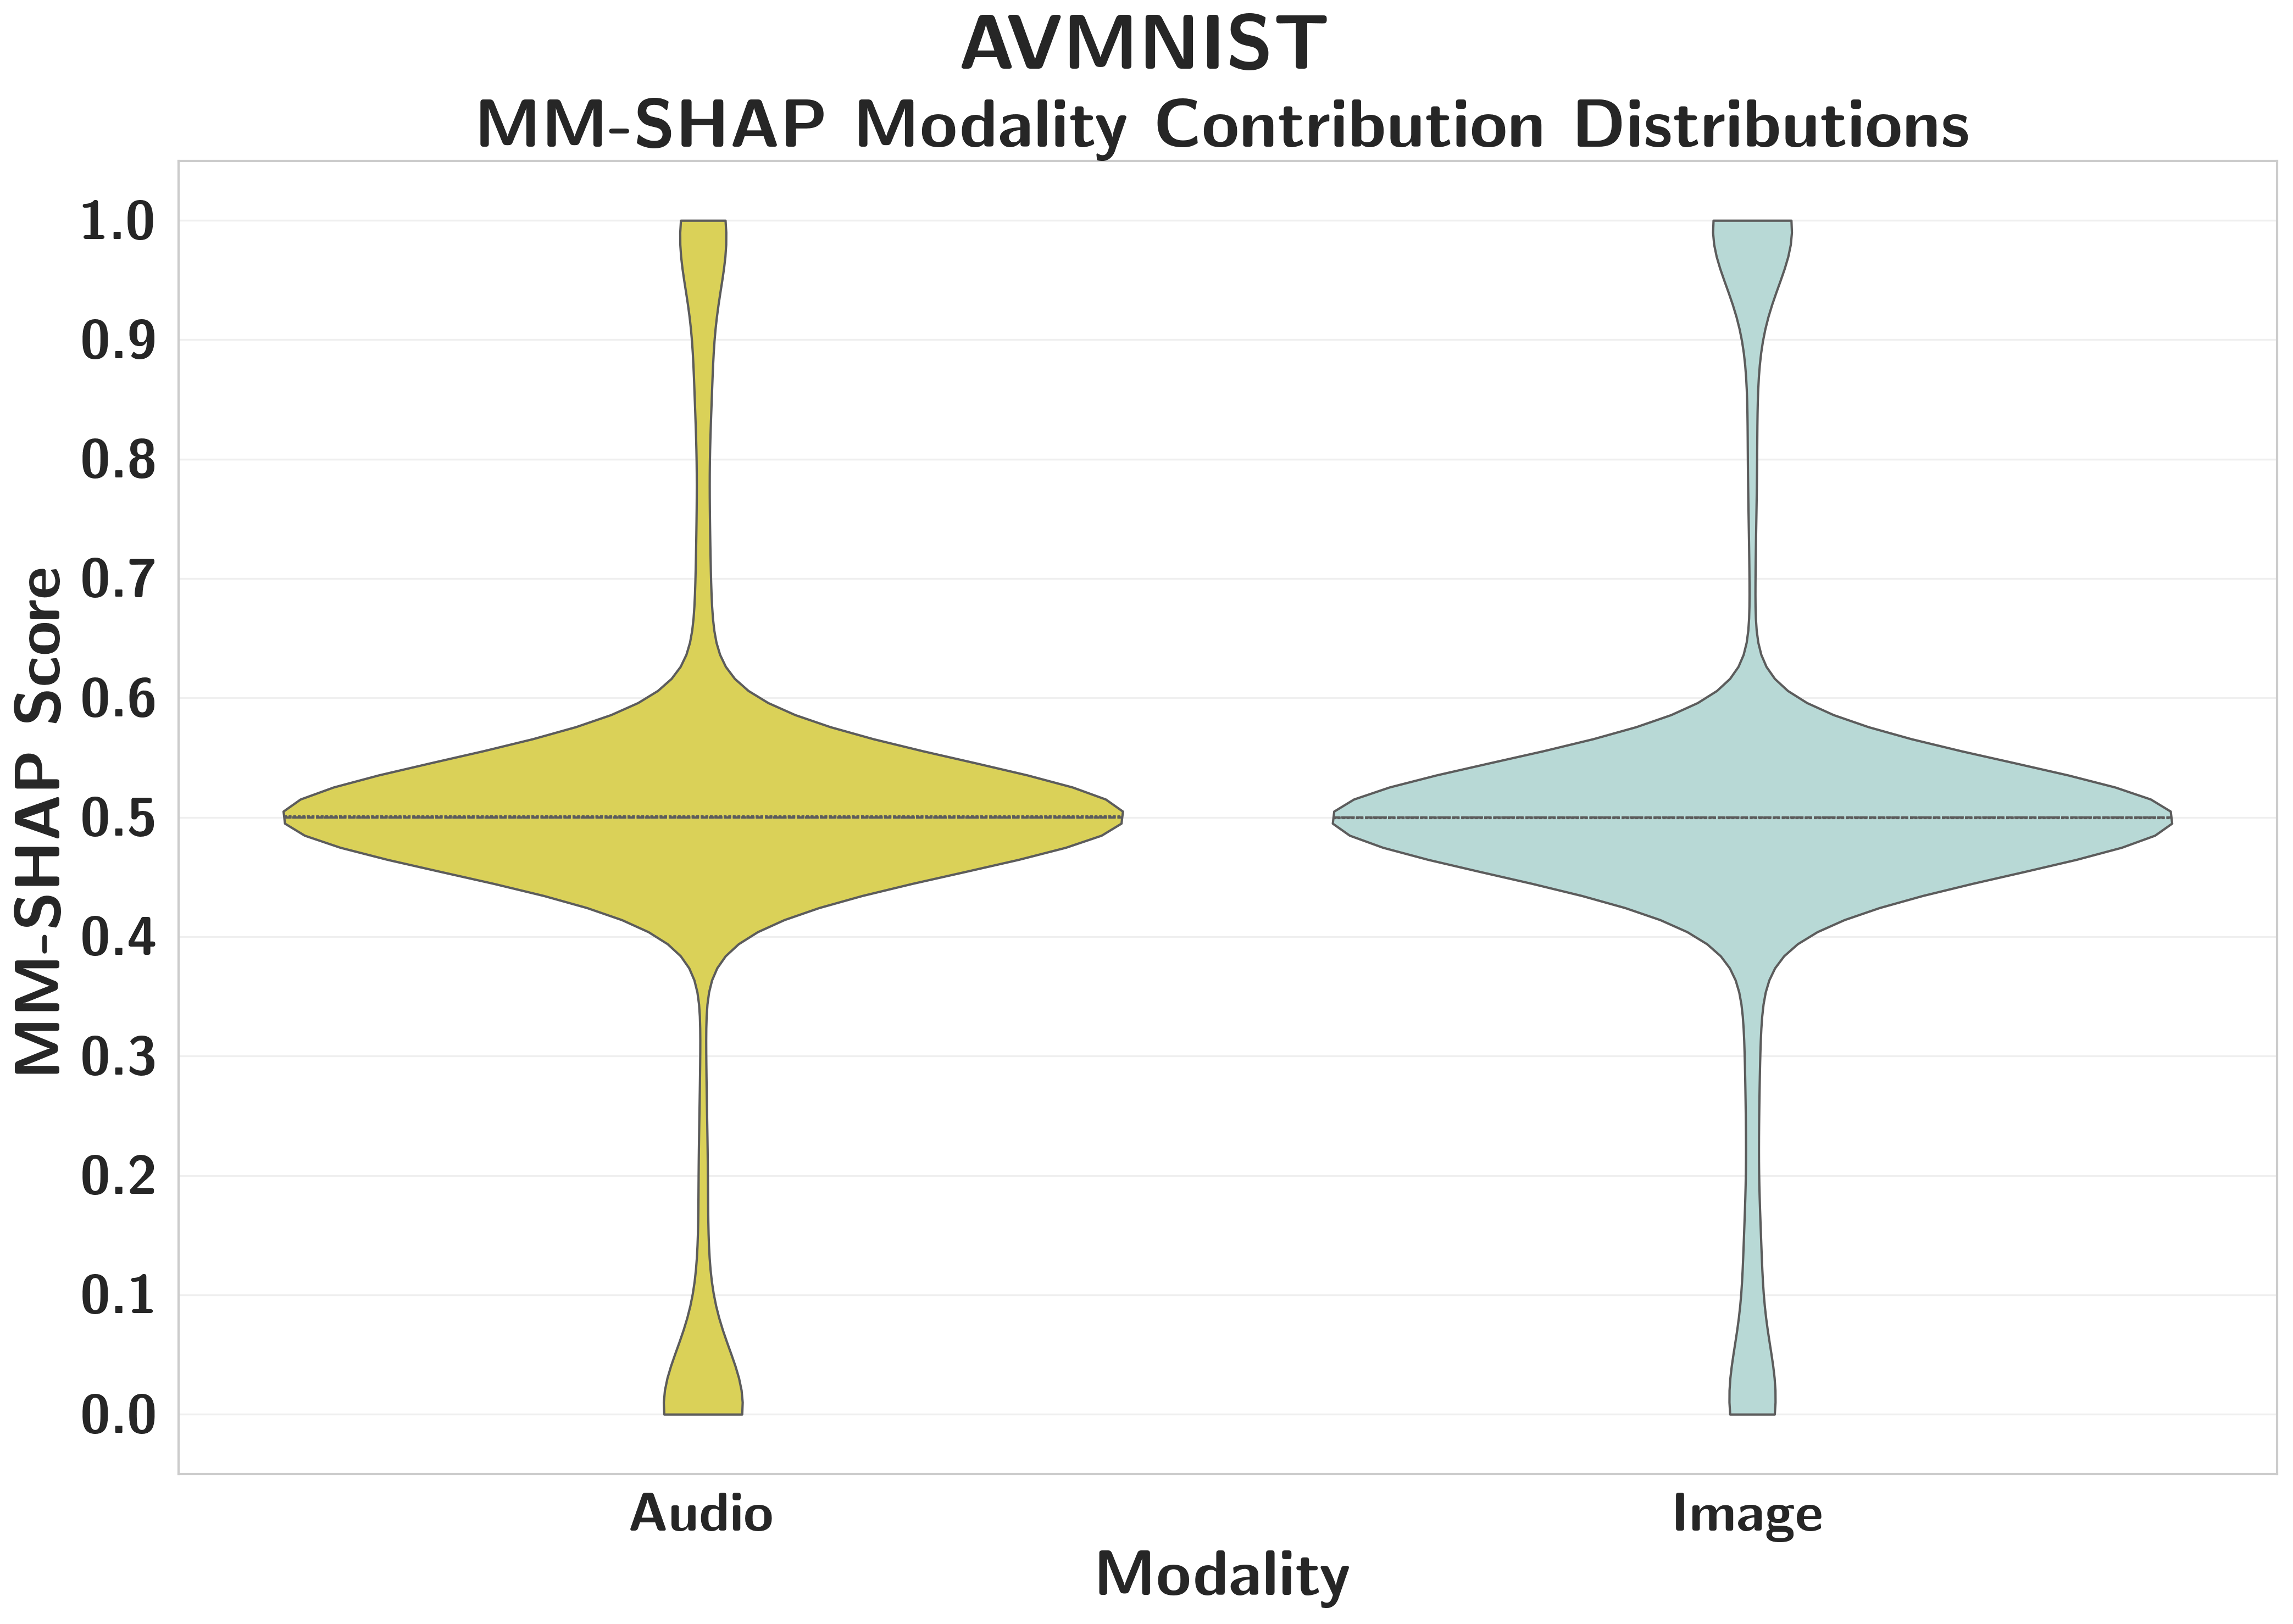
AVMNISTFalse High
Balanced attribution masks extreme functional reliance on visual features; highly attributed modalities can be removed with zero accuracy impact.
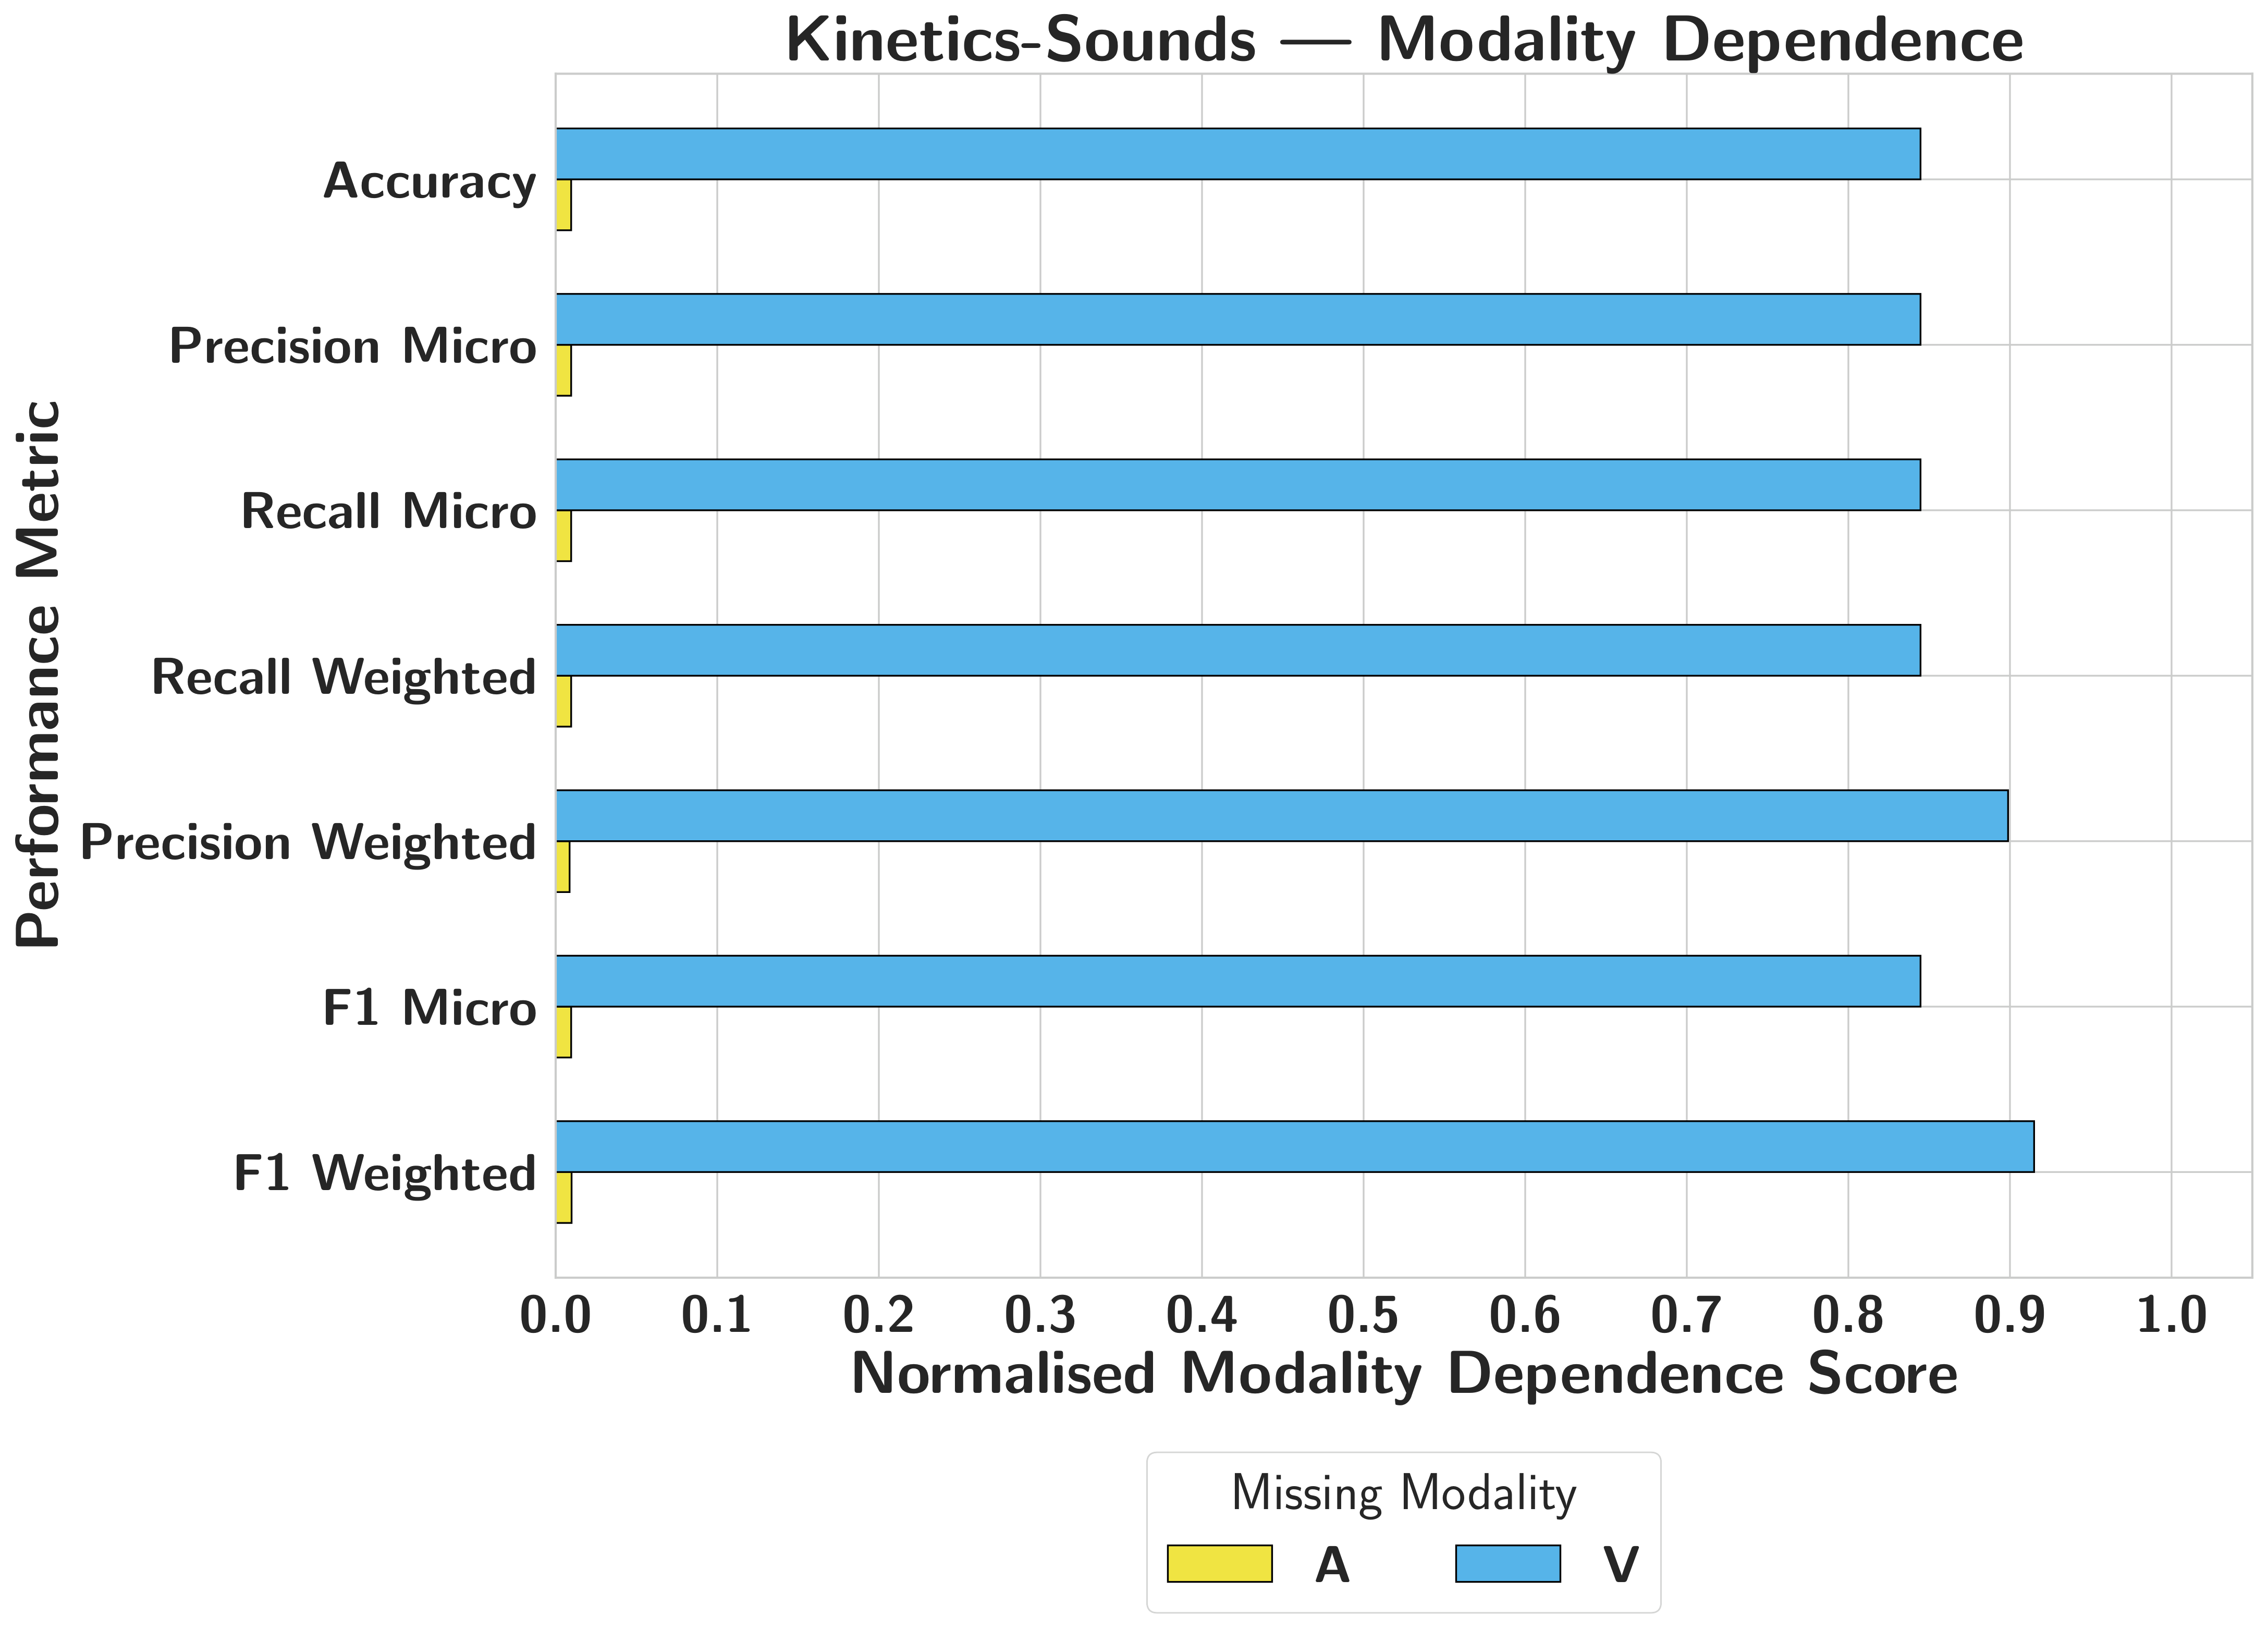
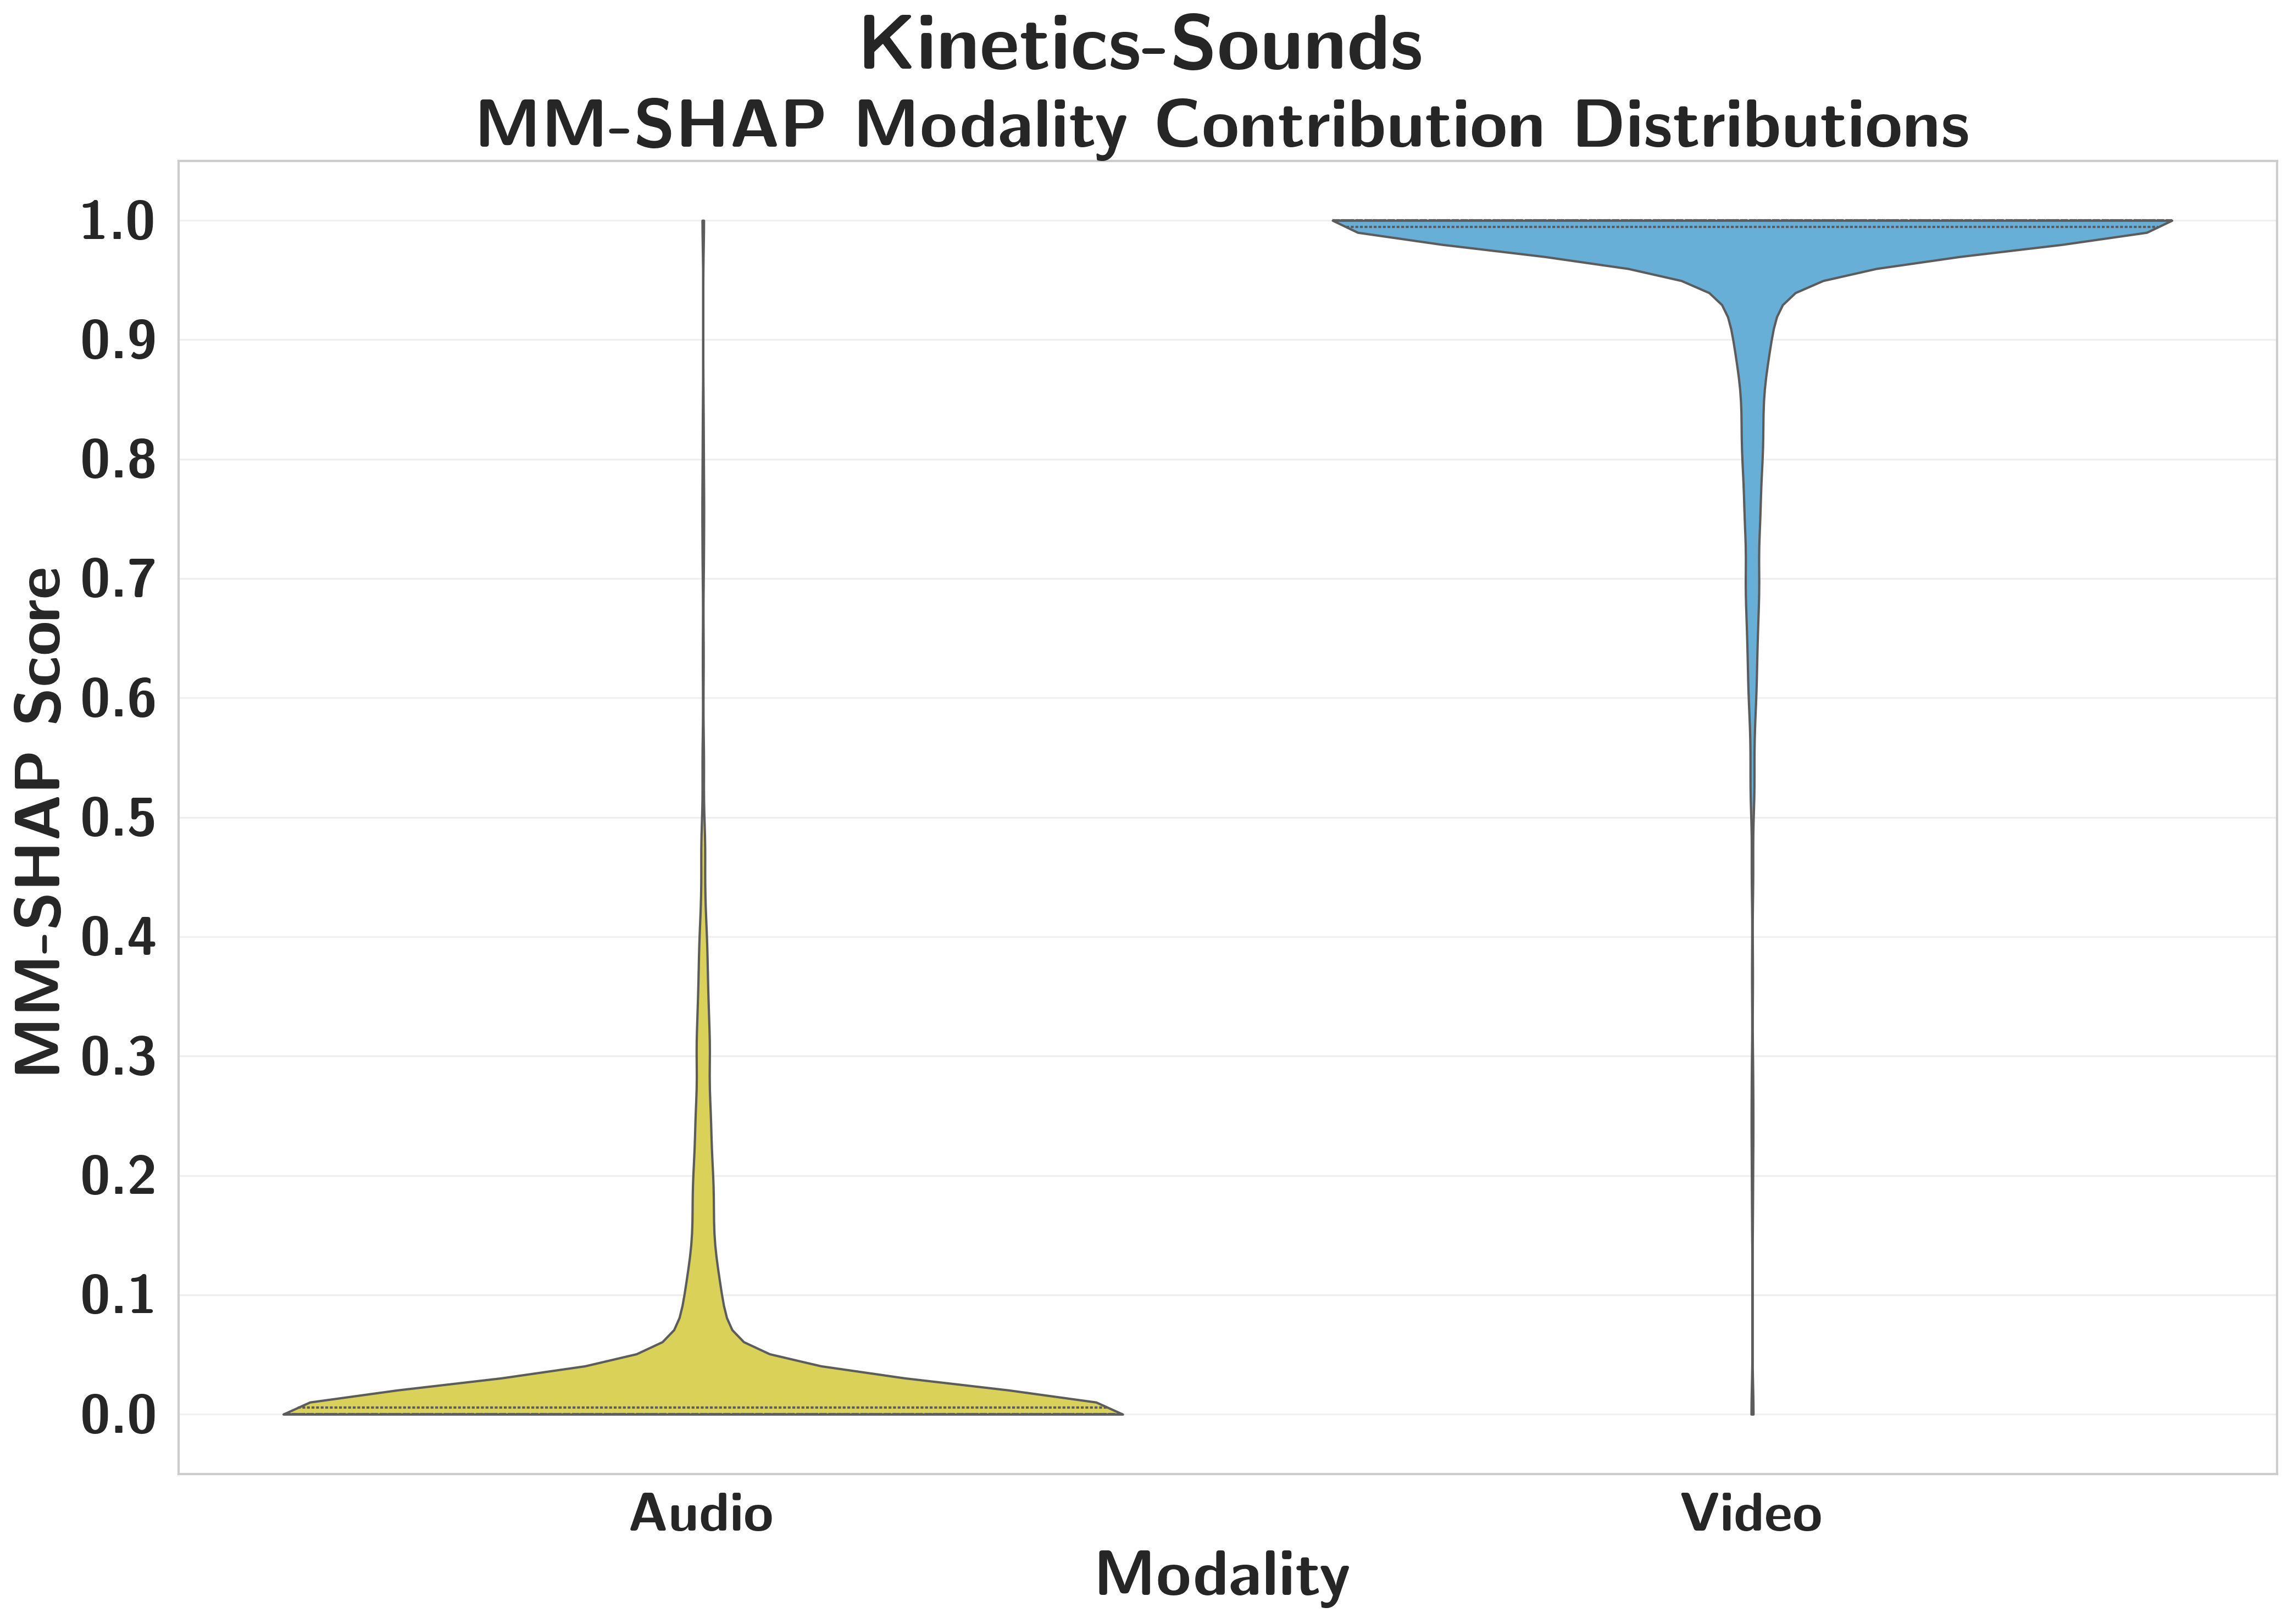
Kinetics-SoundsAttribution Holds
MM-SHAP correctly reflects the asymmetry — audio scores near zero, video near 1.0 — one of the few cases where attribution and functional dependence align.
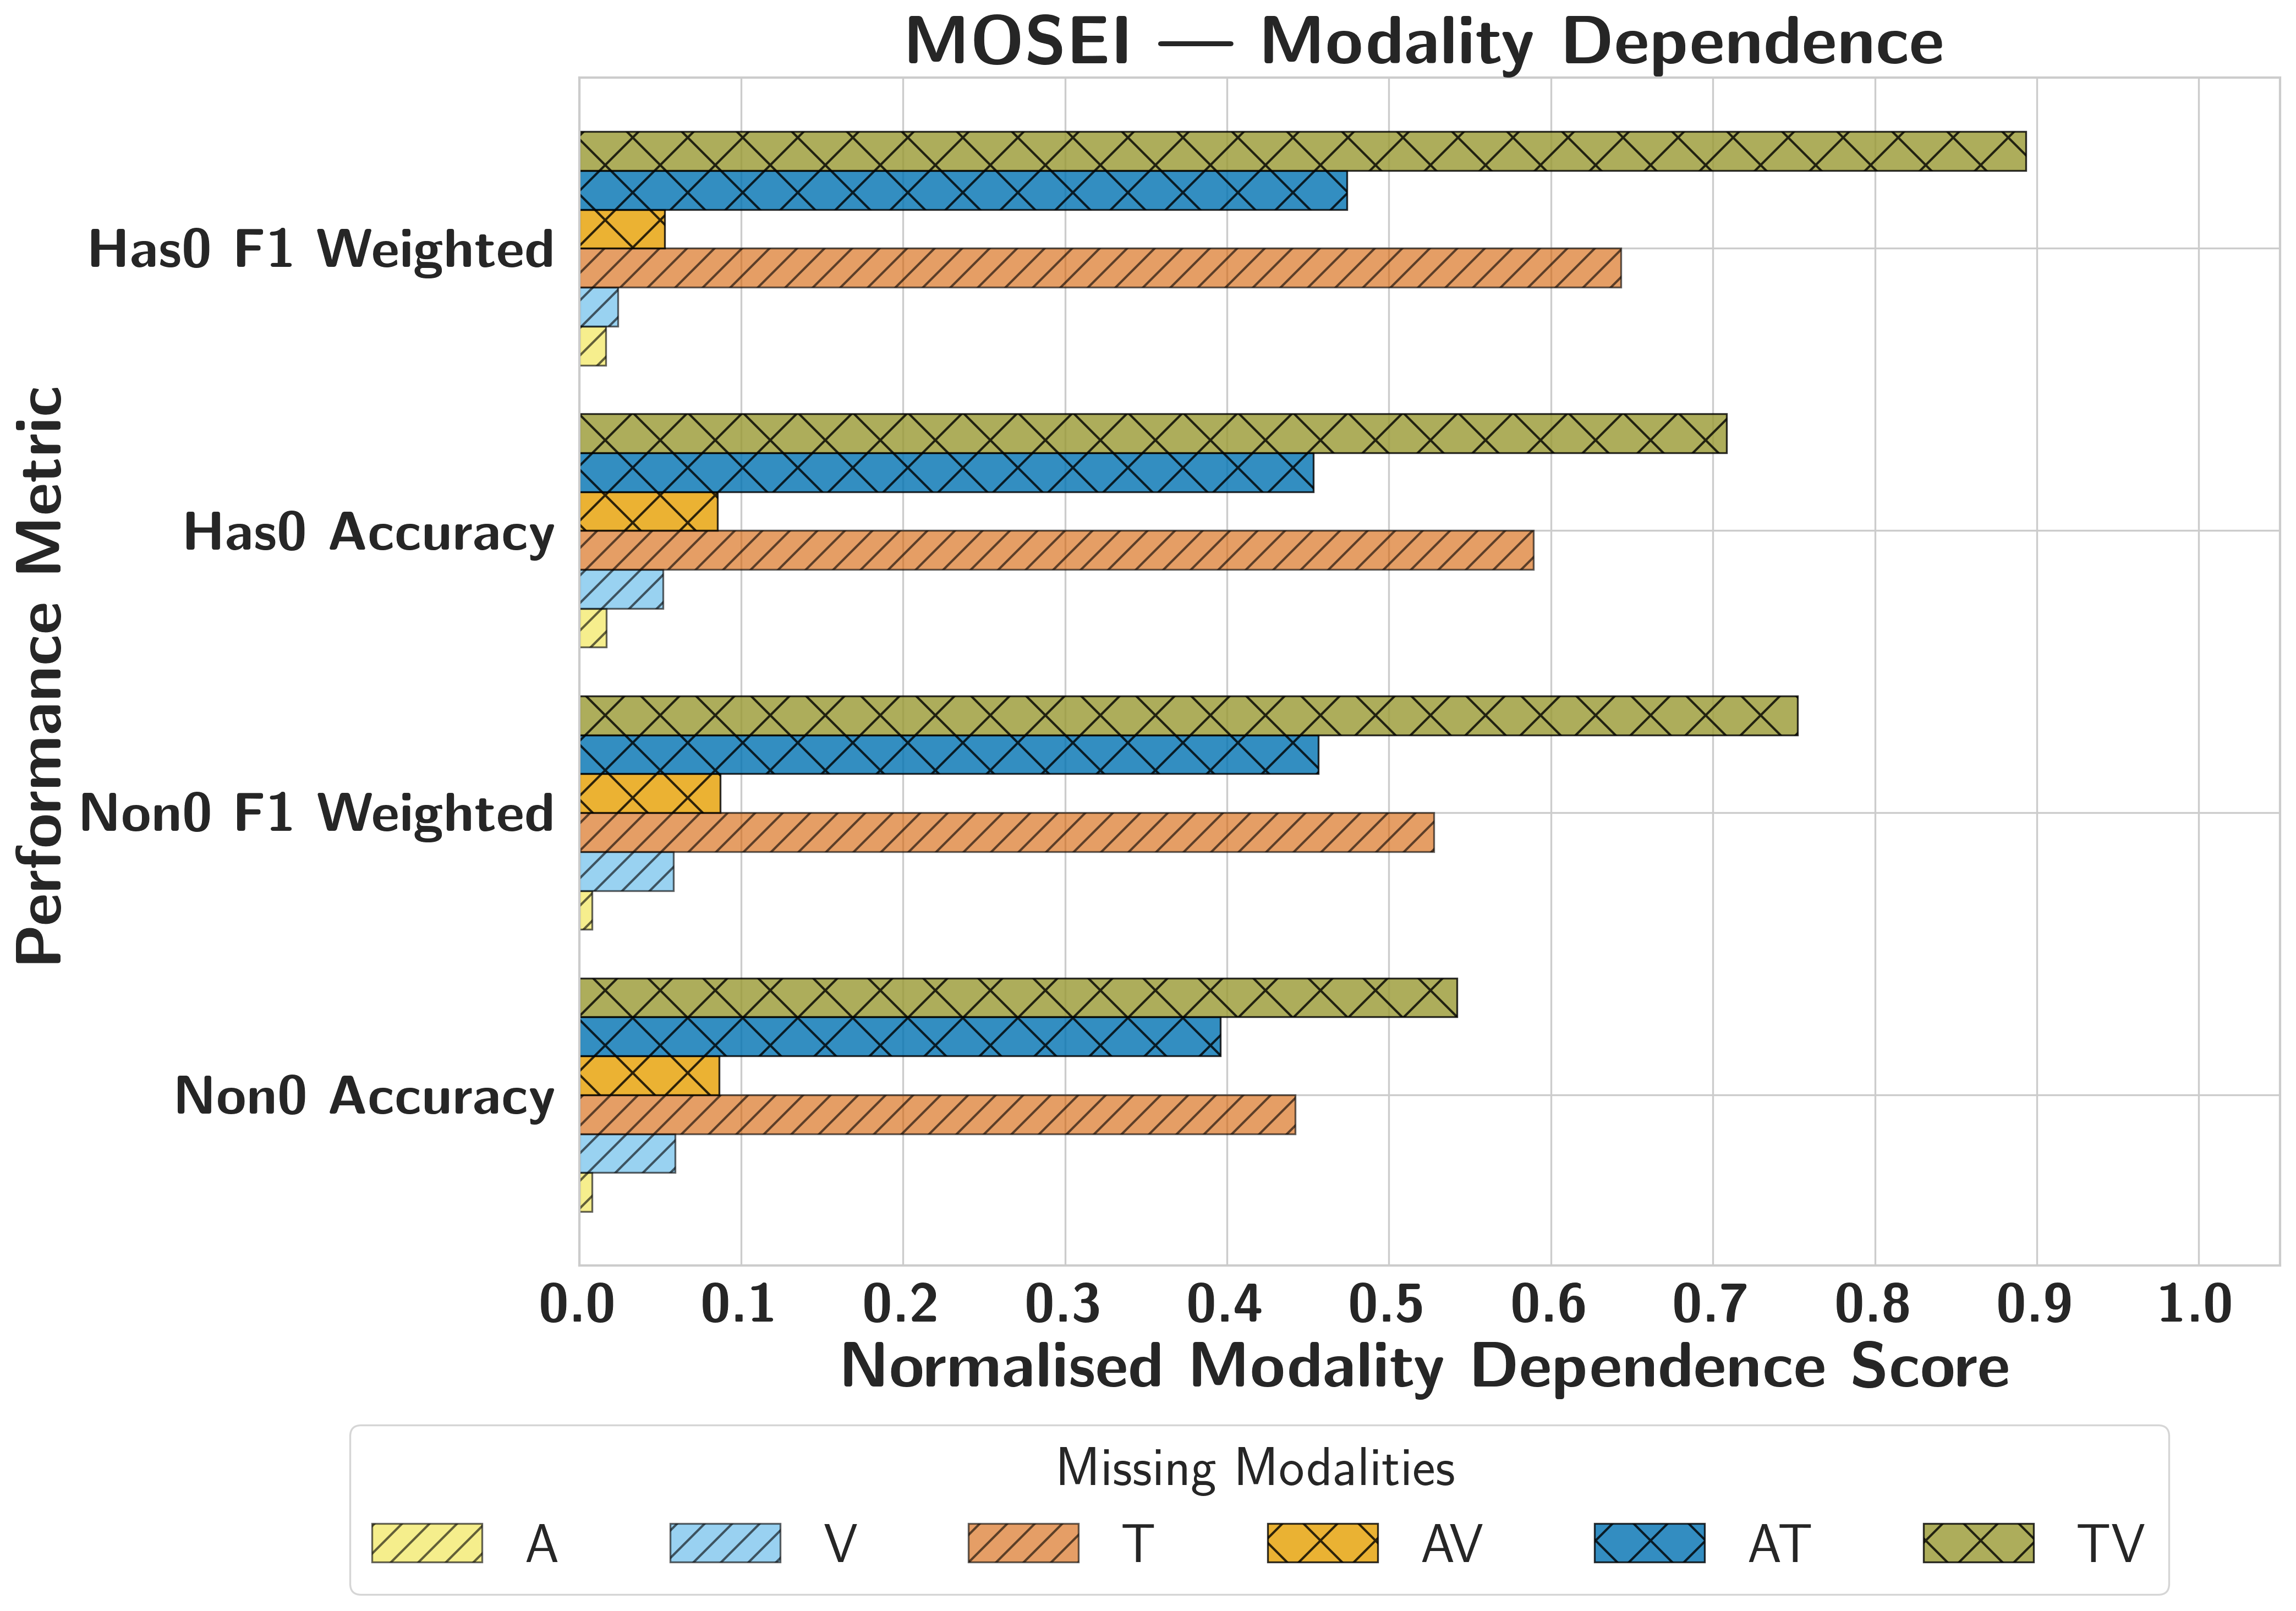
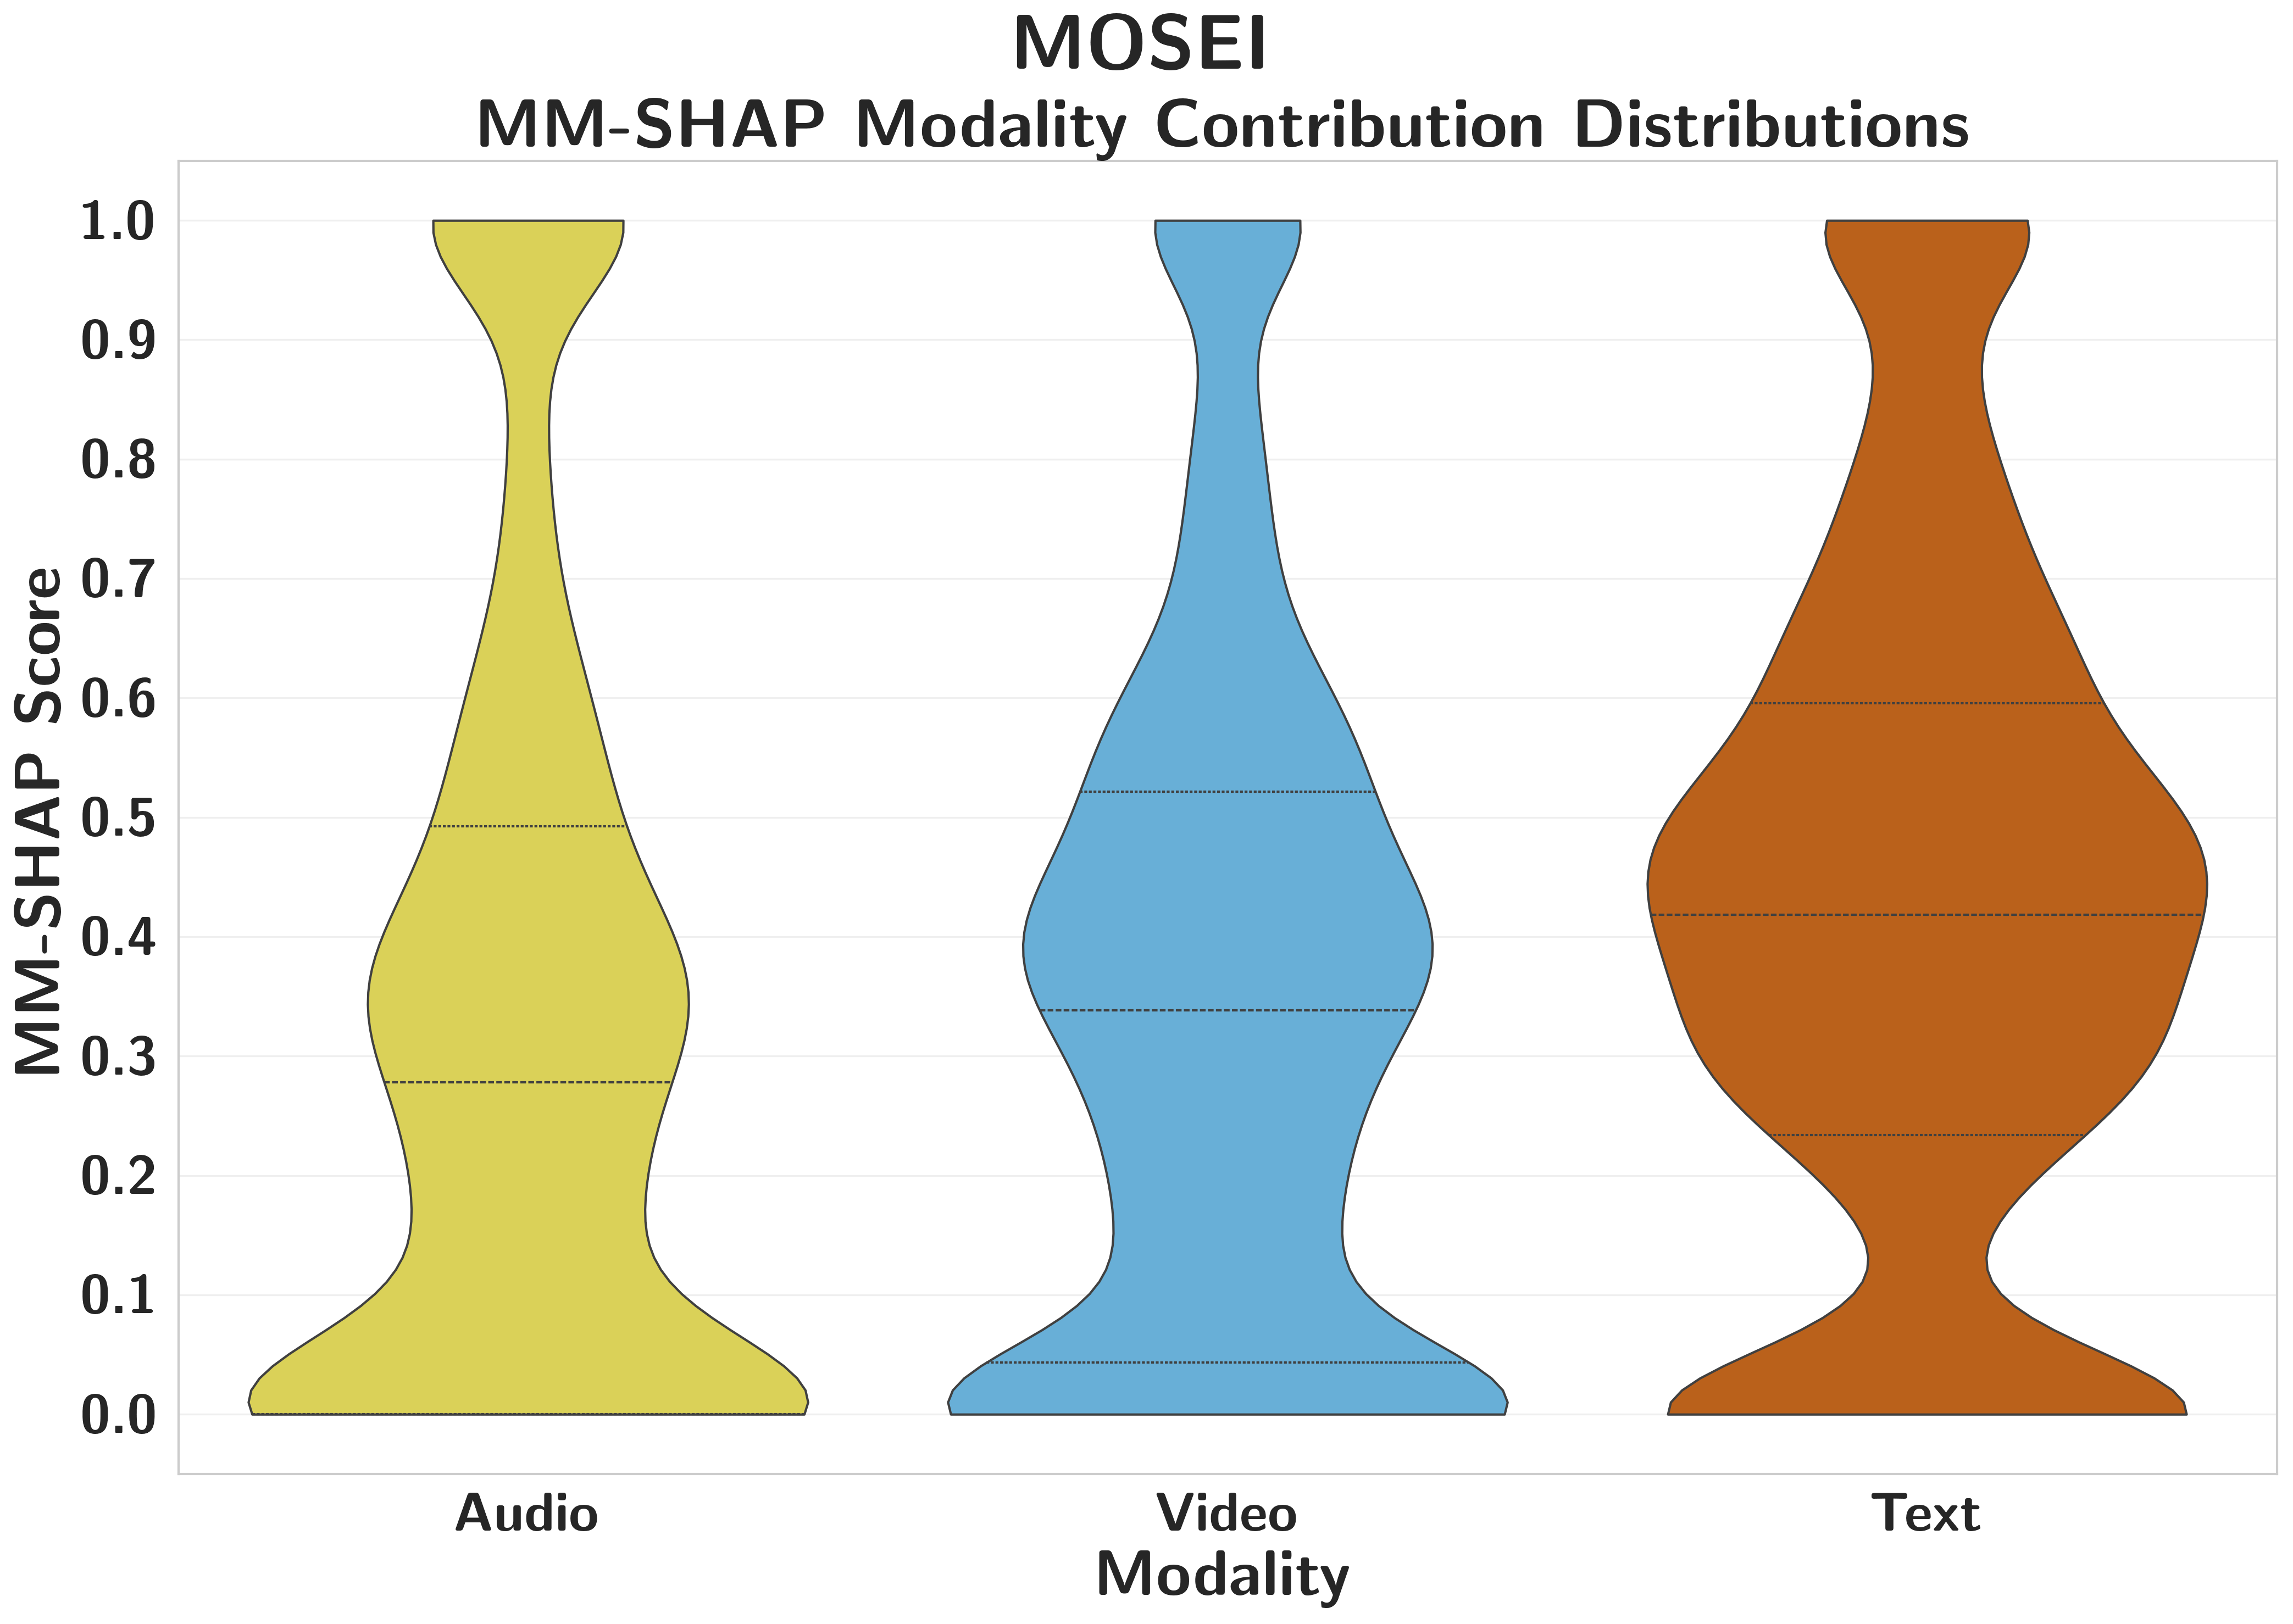
CMU-MOSEIText Dominant
Text drives accuracy and calibration, while MM-SHAP over-attributes redundant audio/video streams that retain high confidence despite accuracy collapse.
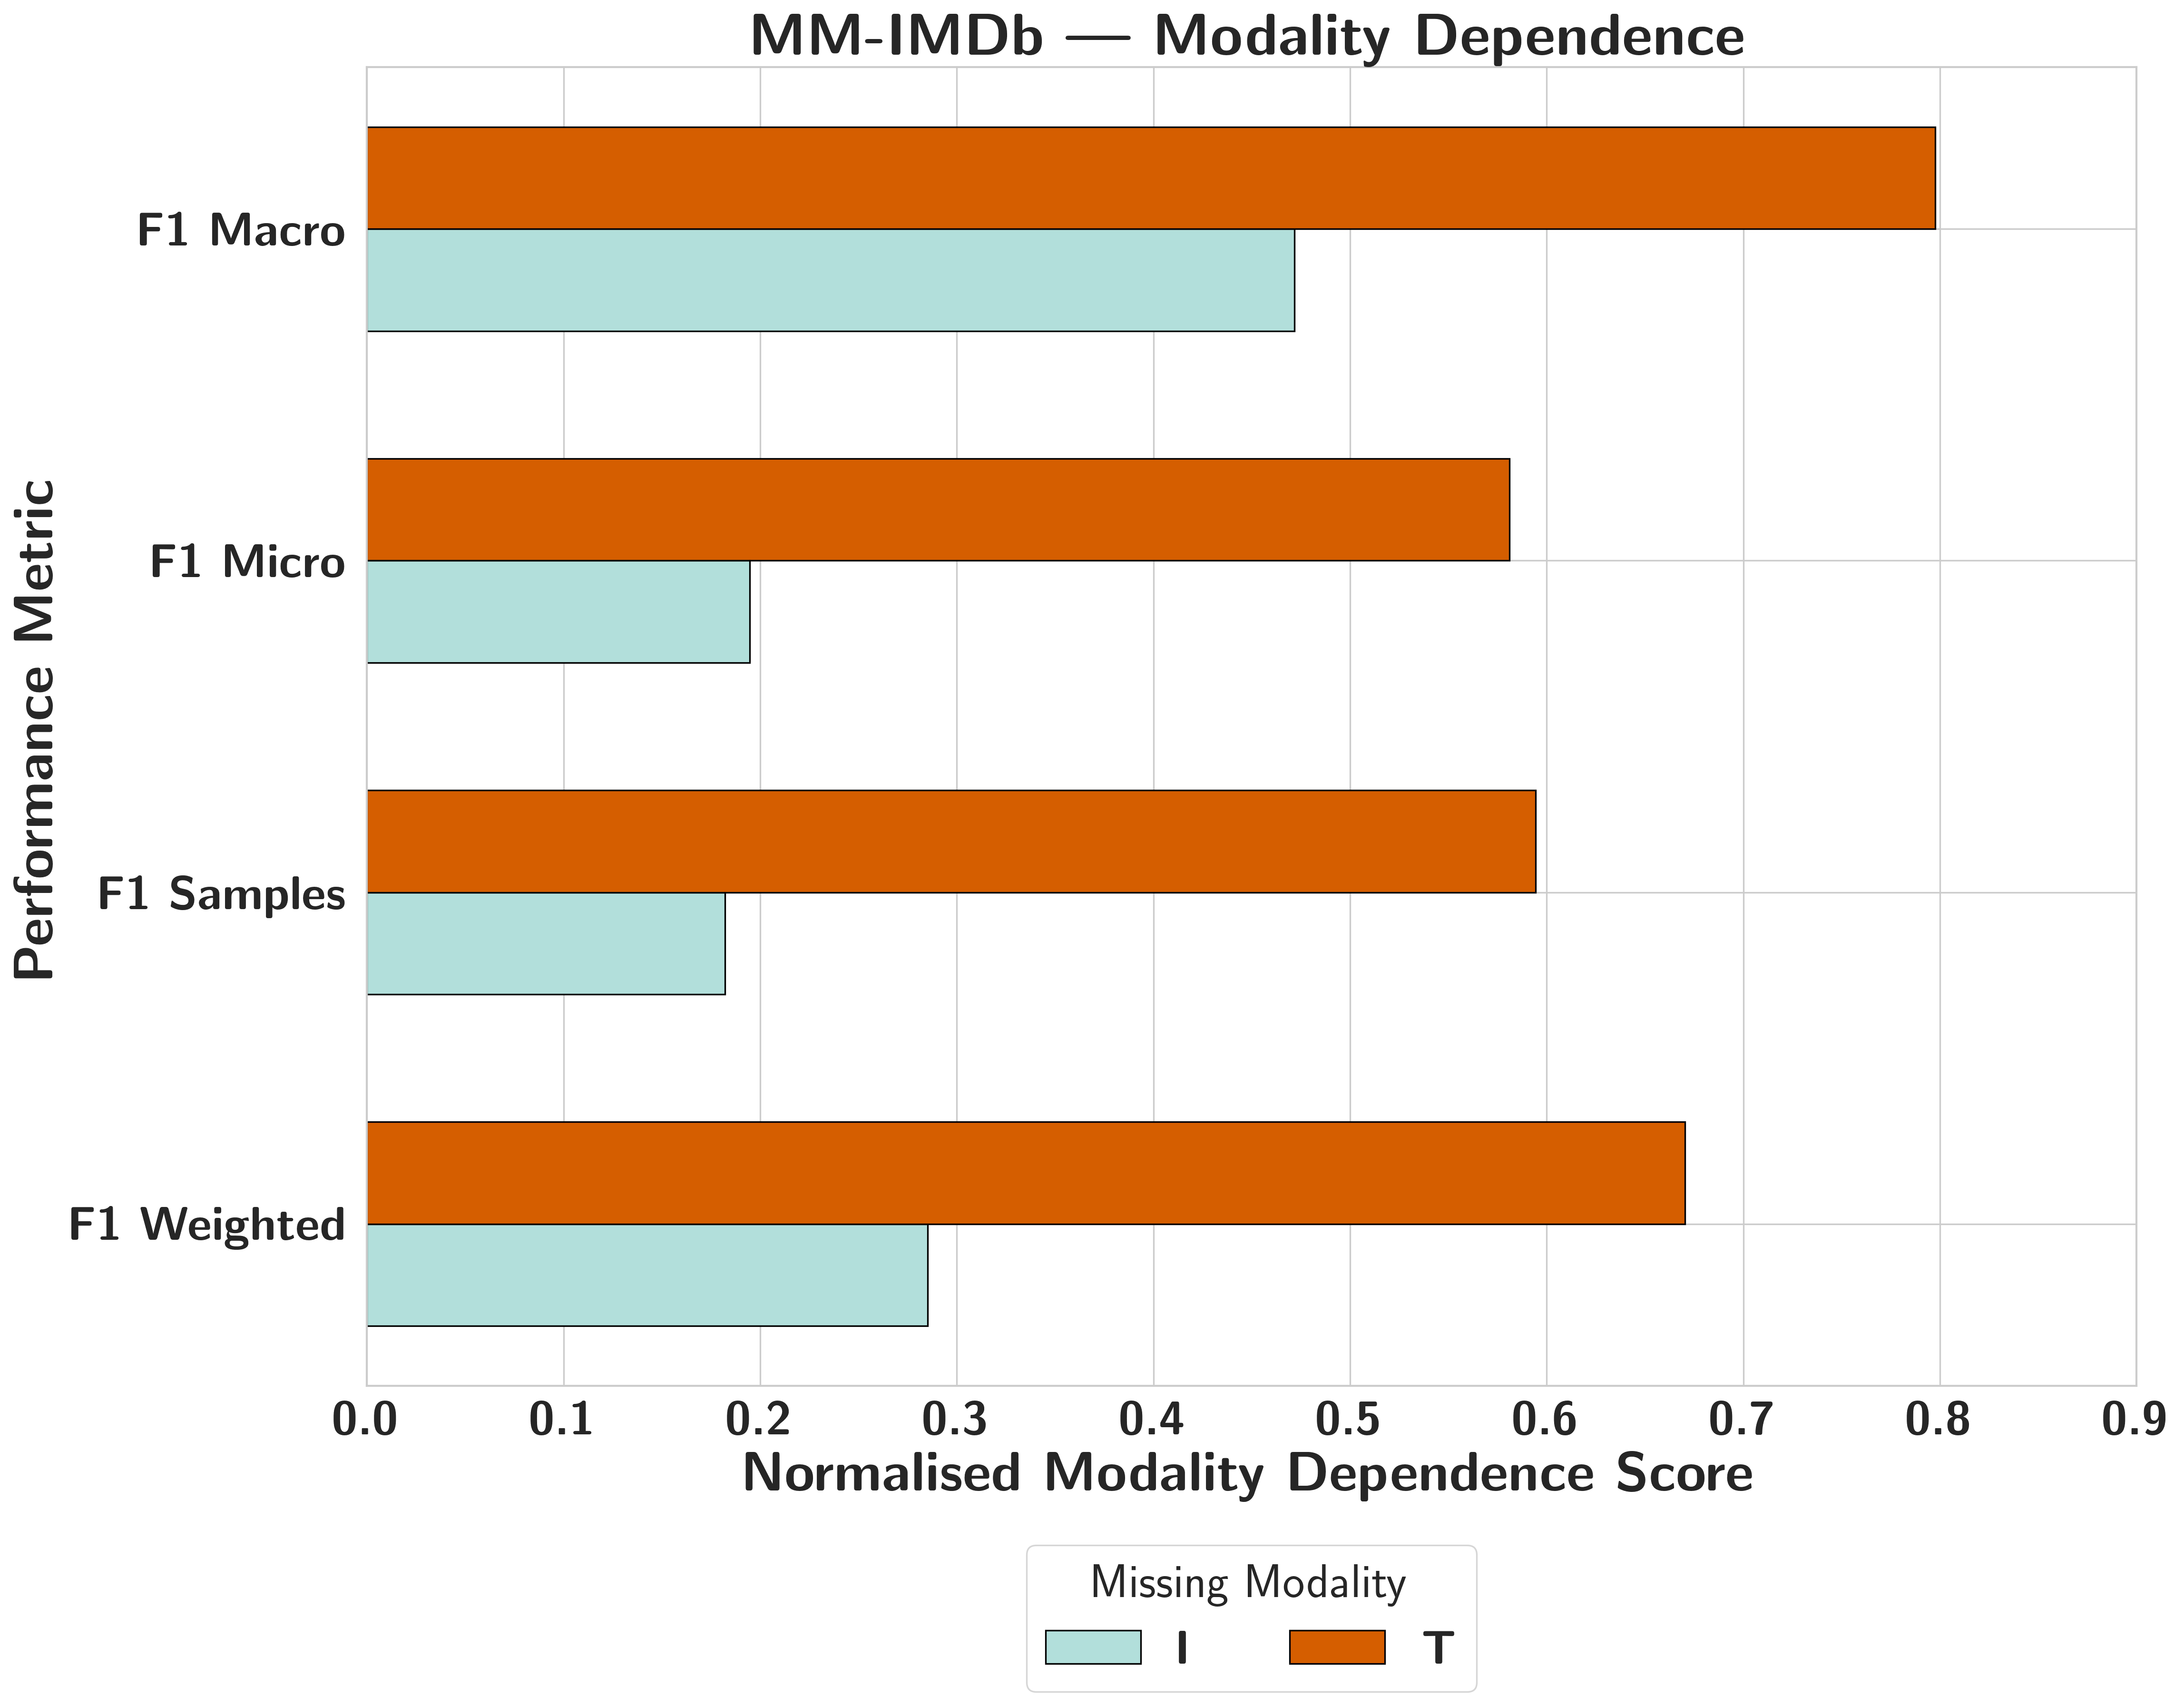
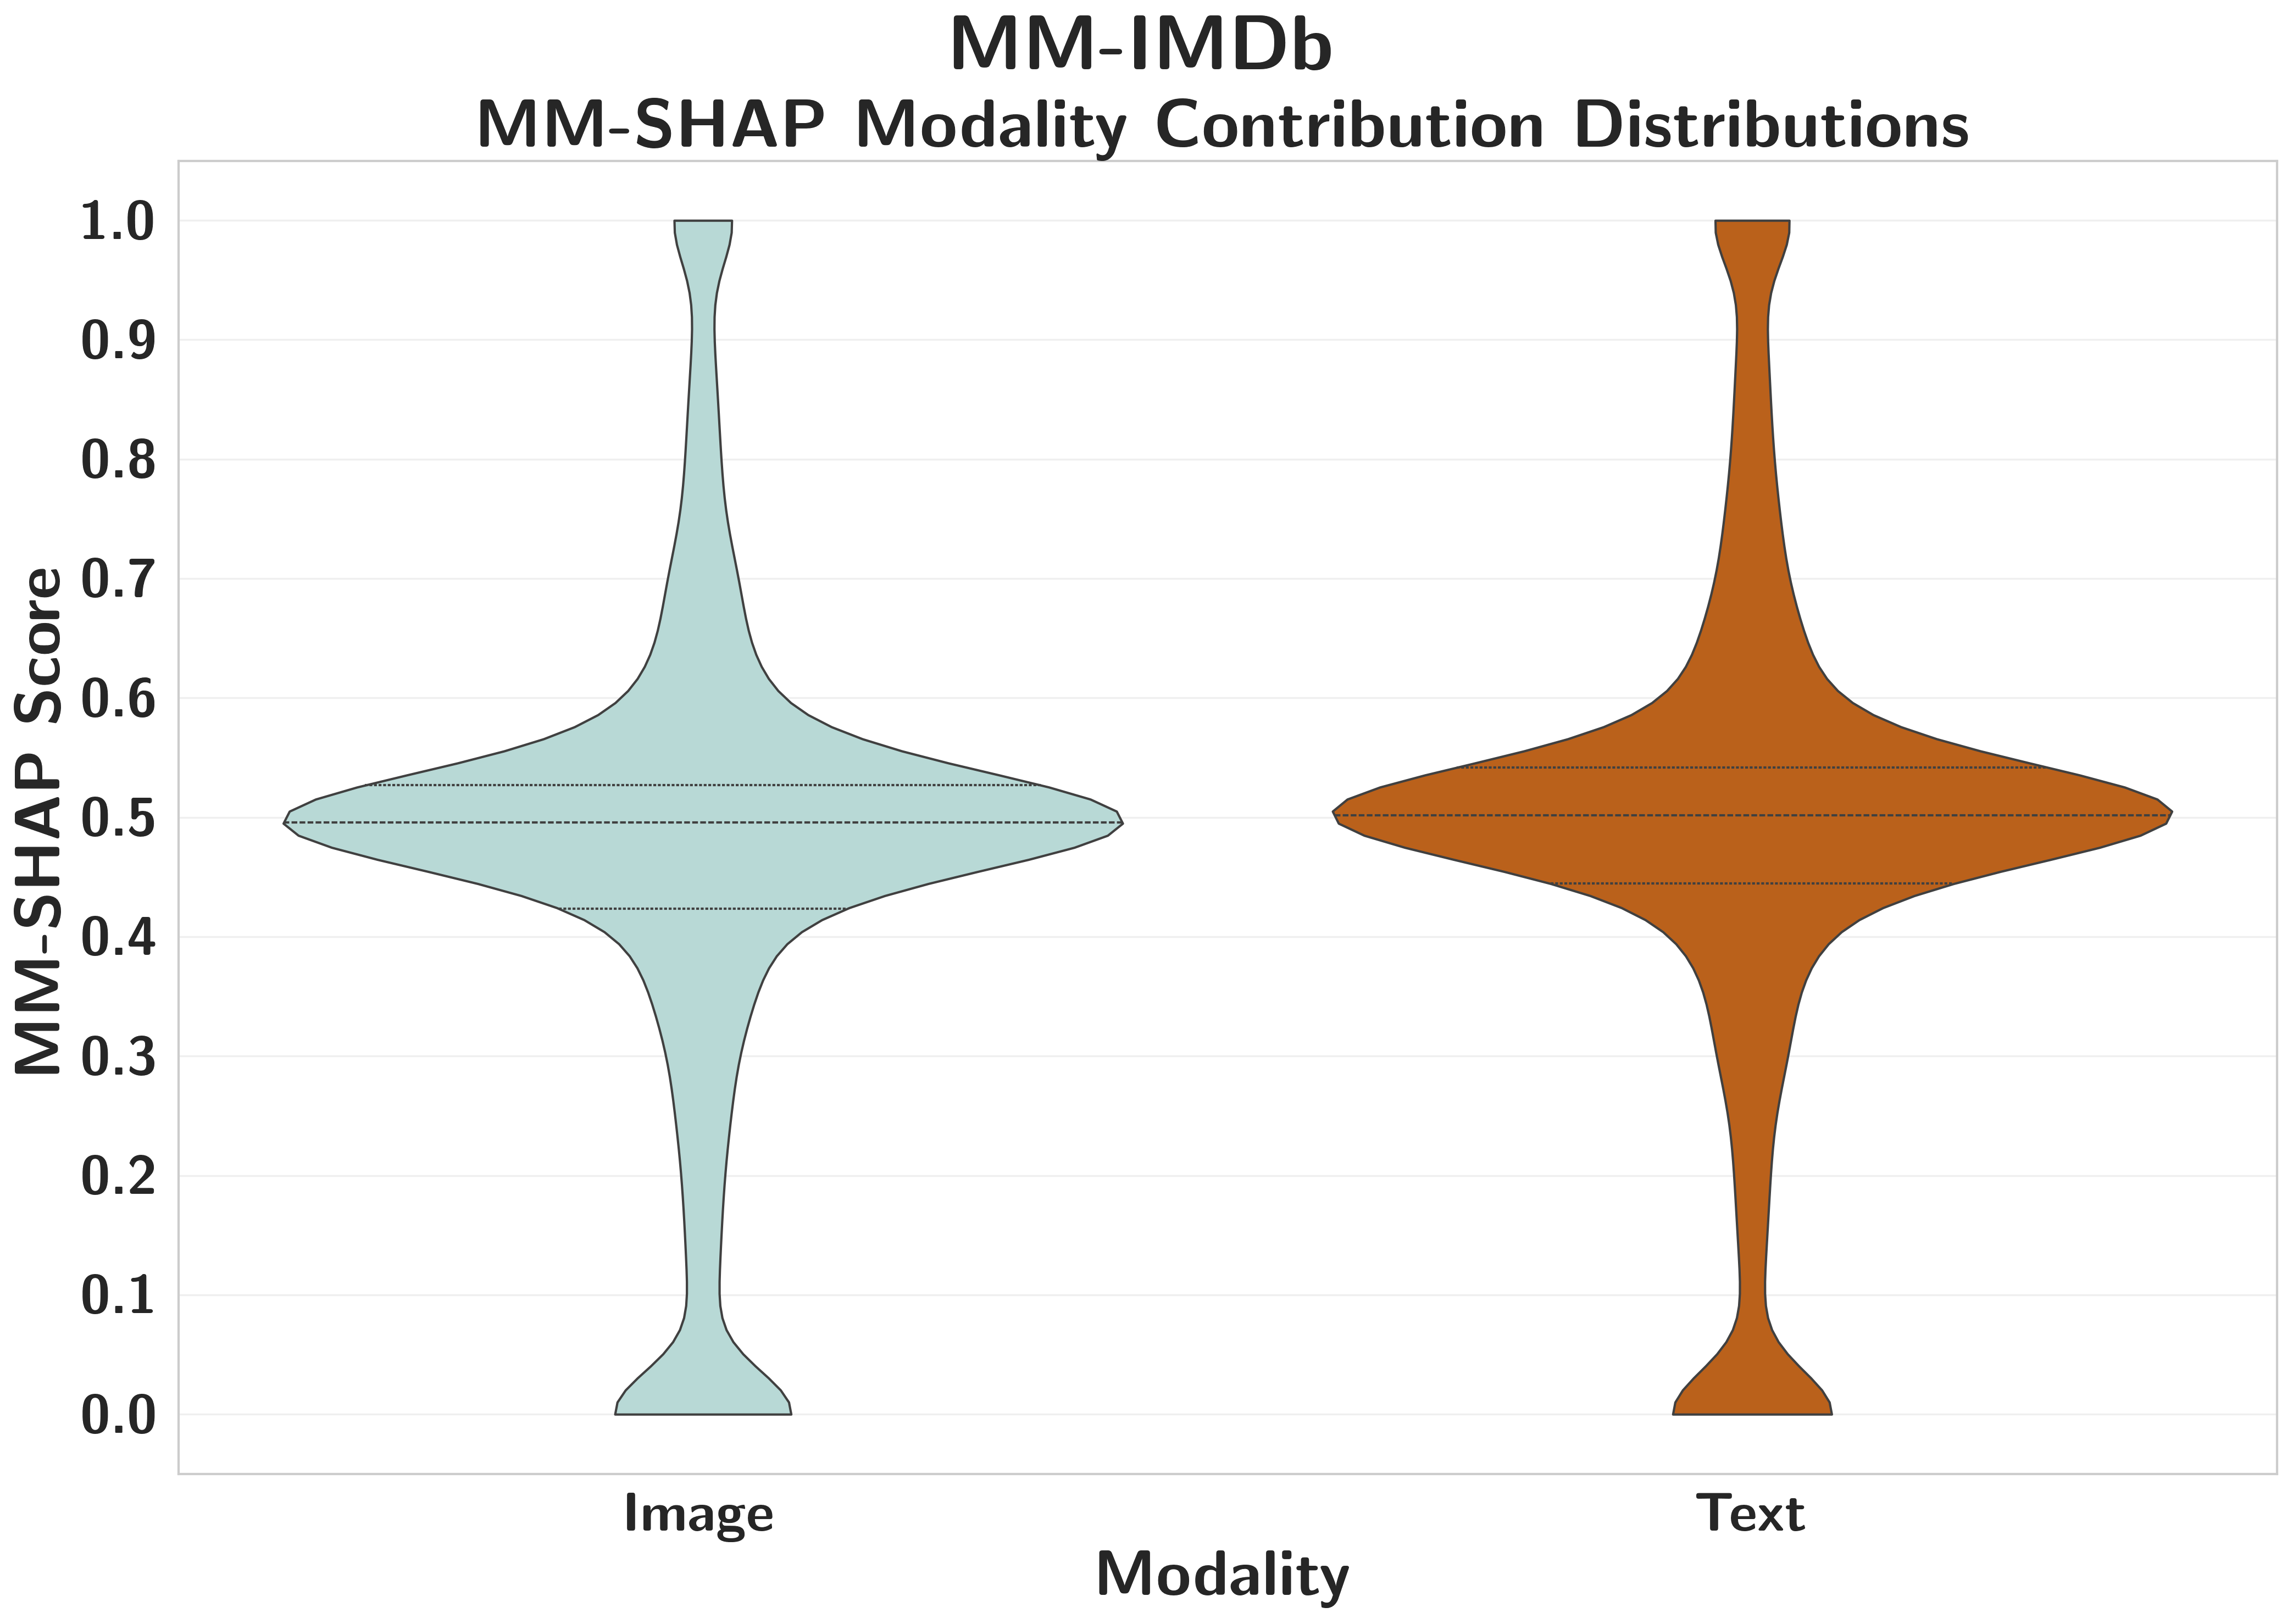
MM-IMDbMasked Dominance
Symmetrical attribution masks structural text dominance; confidence shifts vary across the SHAP spectrum, showing attribution captures engagement rather than functional sensitivity.
What this shows
Modality contribution and modality dependence frequently disagree despite both aiming to quantify the same thing.
Balanced contribution scores mask skewed dependence across multiple datasets, and deeper behavioural probes expose structural fragility that contribution scores alone cannot surface.
Why it matters
MM-SHAP captures surface-level engagement, not functional necessity.
A complete evaluation requires measuring both contribution and dependence, neither in isolation tells the full story.
RQ1.2
RQ1 — Modality Absence and Behavioural DegradationRQ1.2 Results
RQ1.2 — Zero masking vs Gaussian noise
Gaussian noise does not consistently improve on zero masking; the optimal absence representation is encoder-specific and must be validated empirically.
AVMNISTZero better
Structured nulls are in-distribution; encoders were trained with silence and blank frames as the normal zero state.
MM-IMDbMixed
Text favours stable nulls; image masking has negligible effect, as the visual stream is functionally weak and redundant.
MOSEINoise better
Zero injects misleading semantic structure; noise better represents true absence for all three modalities.
Cross-dataset Cohen's d: zero vs.
Gaussian noise masking
Dataset
Modality
Cohen's d
p-value
Better
AVMNIST
Audio
−3.34
0.014
Zero
↳
Image
−3.33
0.014
Zero
MM-IMDb
Text
−1.73
0.031
Zero
↳
Image
−0.41
0.34
n.s.
MOSEI
Audio
+3.54
<0.05
Noise
↳
Video
+1.85
<0.05
Noise
↳
Text
+4.22
<0.05
Noise
Cohen's d sign: negative => zero better; positive => noise better.
All significant effects are large (|d|≥1.85).
What this shows
How absence is represented changes how the model behaves.
Zero-masking and Gaussian noise produce inconsistent results across datasets.
Neither is a safe universal default, and models respond in ways that cannot be predicted from contribution scores alone.
Why it matters
Masking strategy is not a neutral implementation detail, it is a design decision that directly shapes measured robustness.
Credible evaluation requires understanding which representation of absence a given architecture is sensitive to.
RQ1.3
RQ1 — Modality Absence and Behavioural DegradationRQ1.3 Results
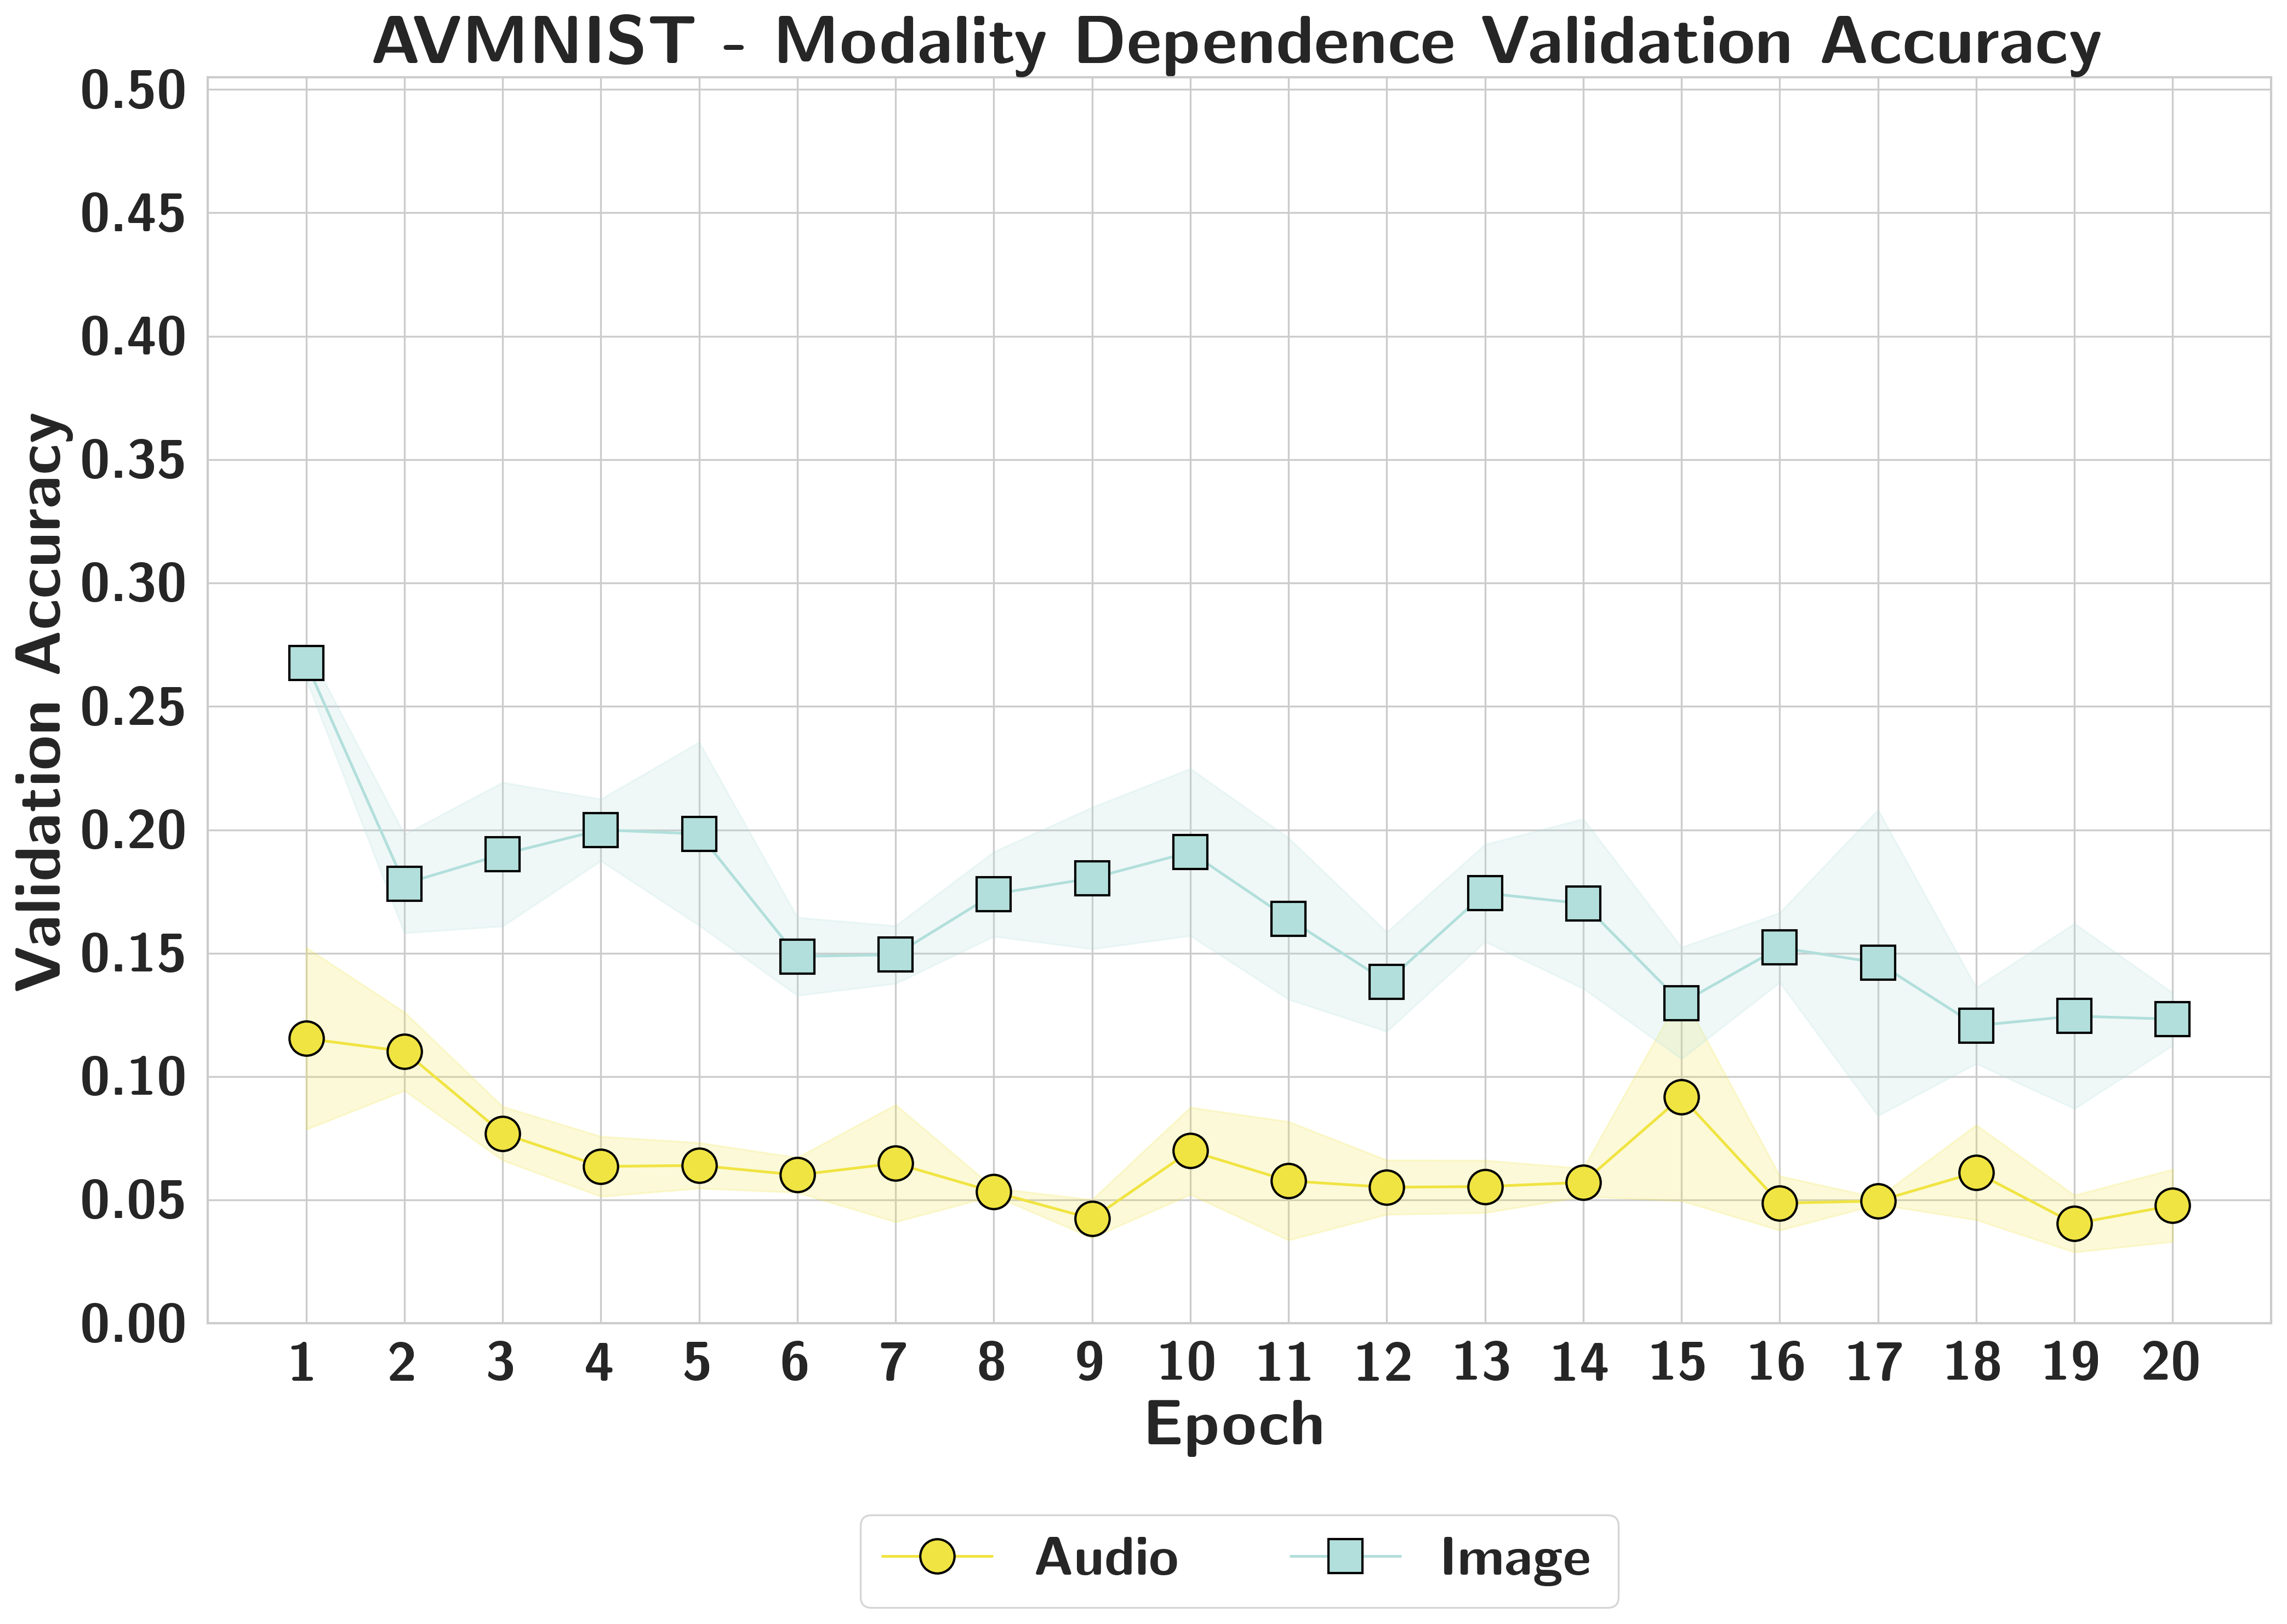
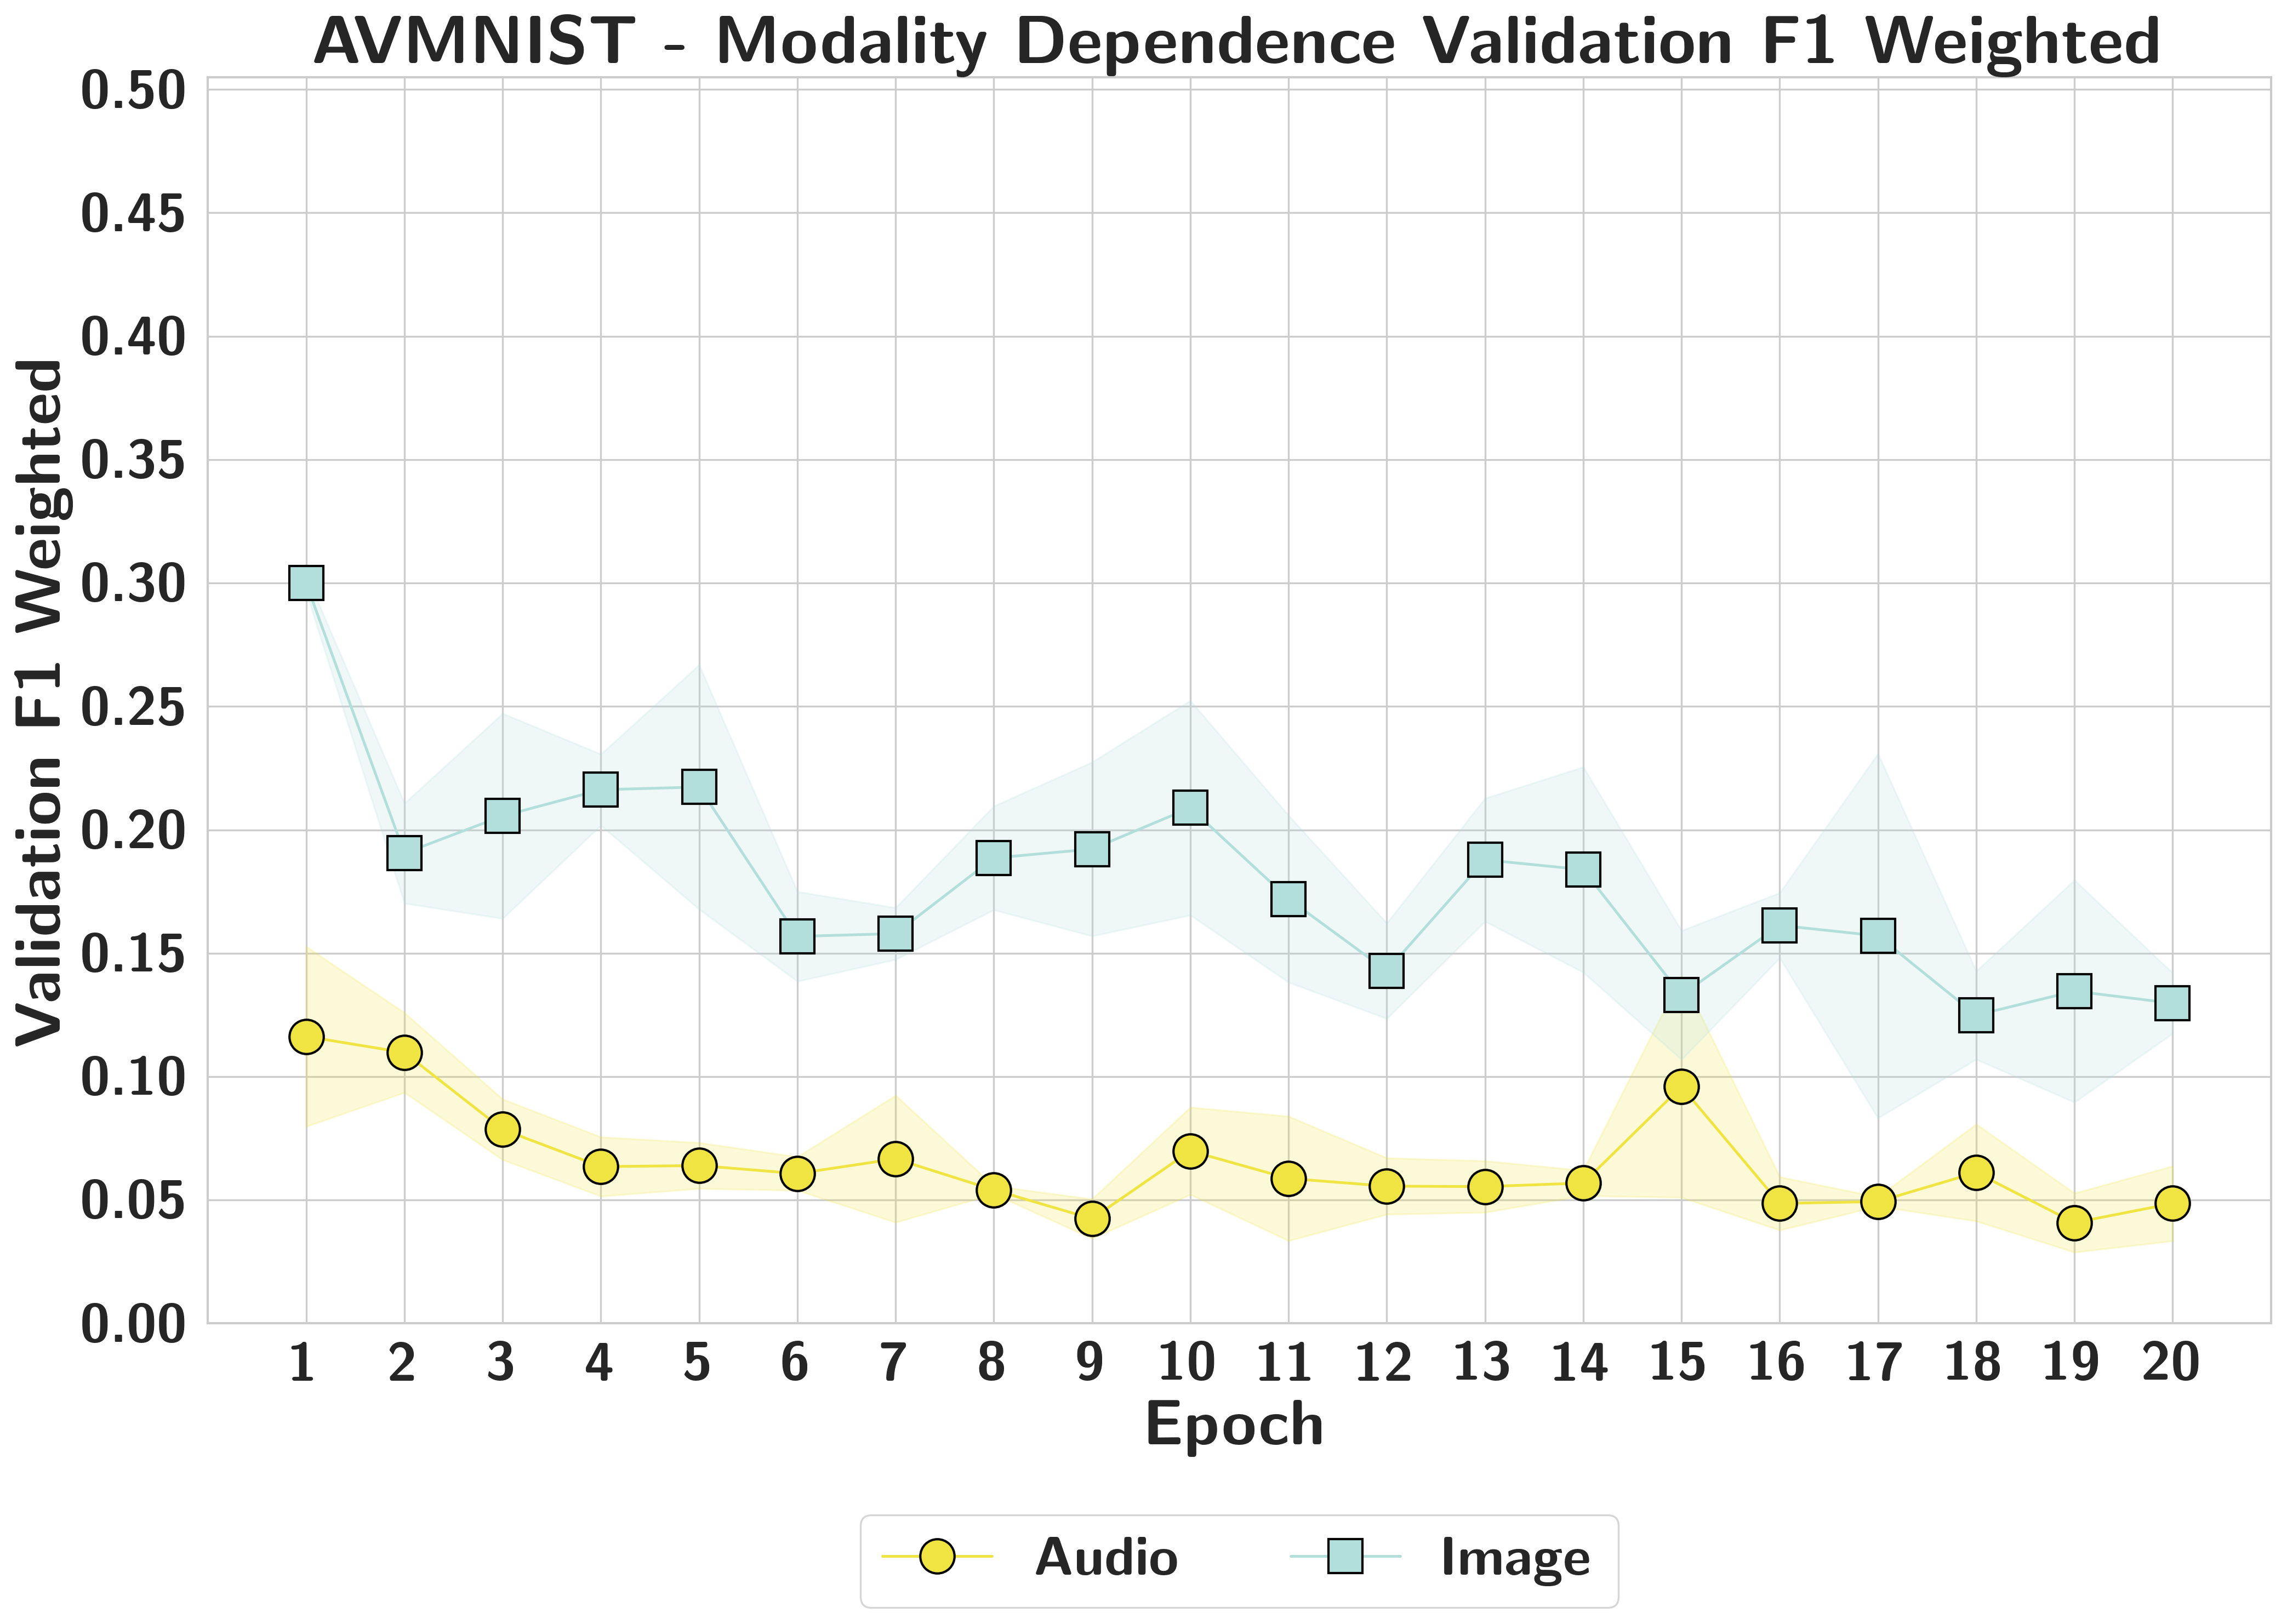
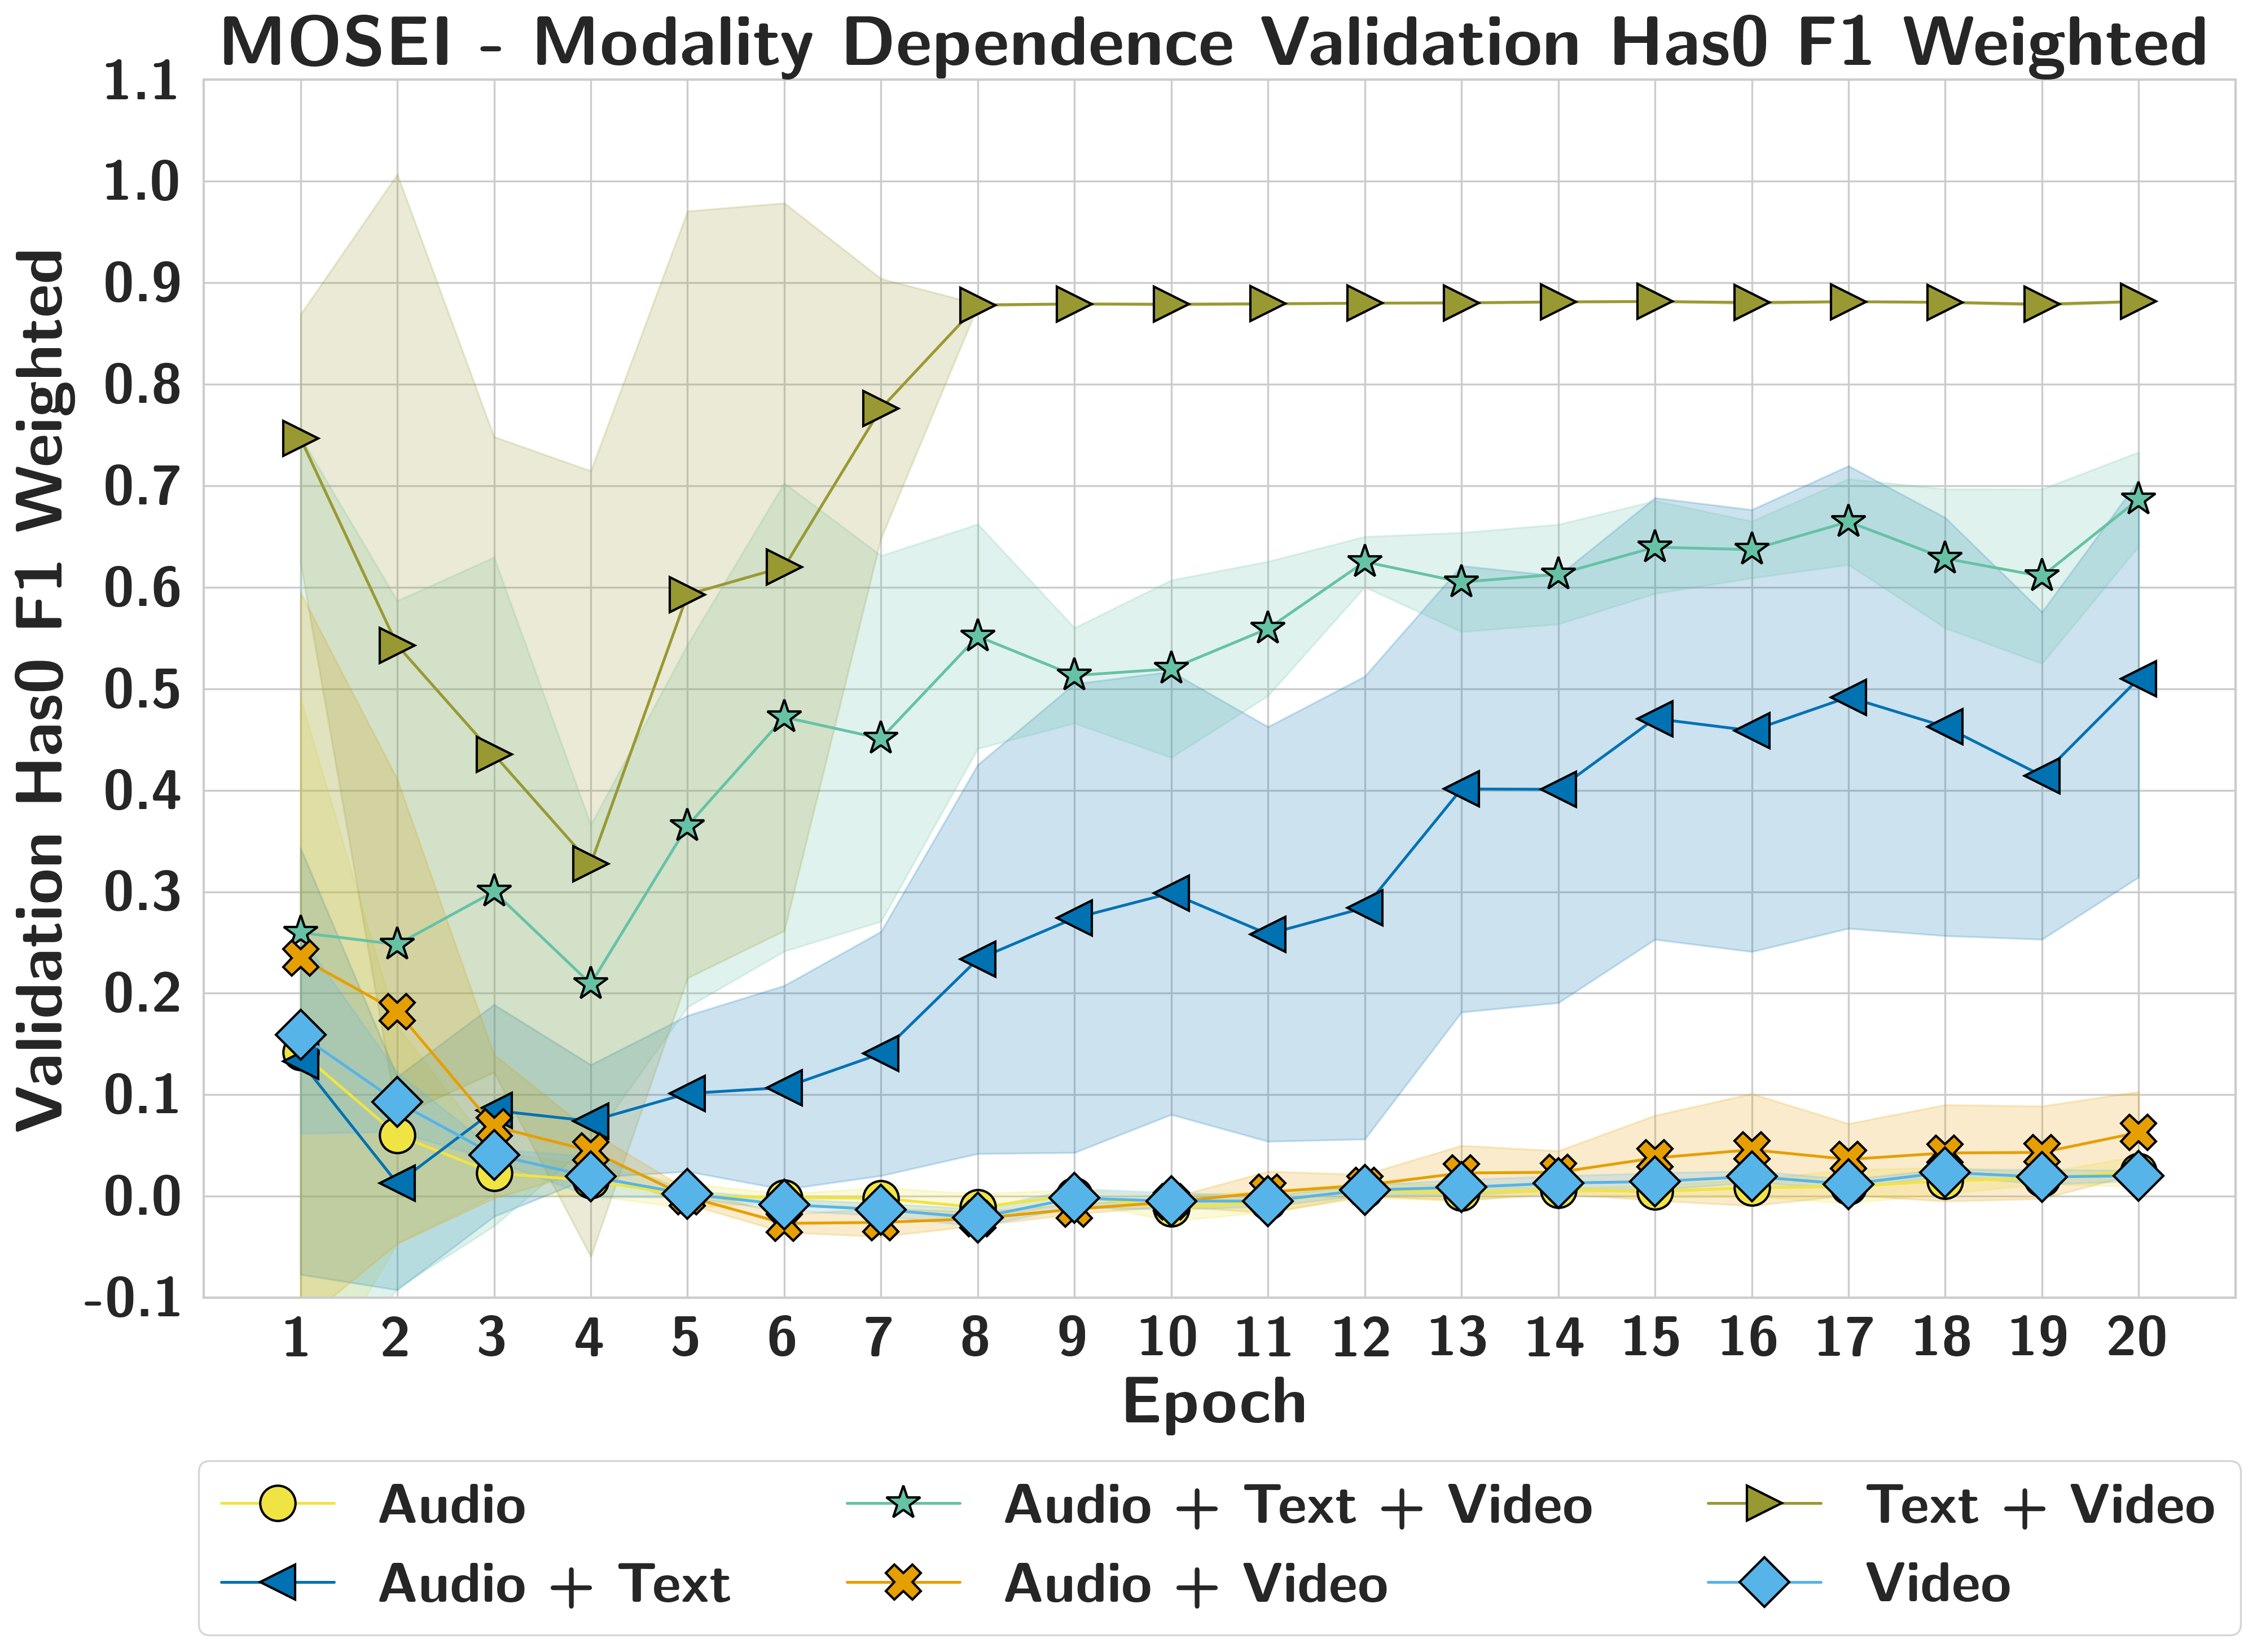
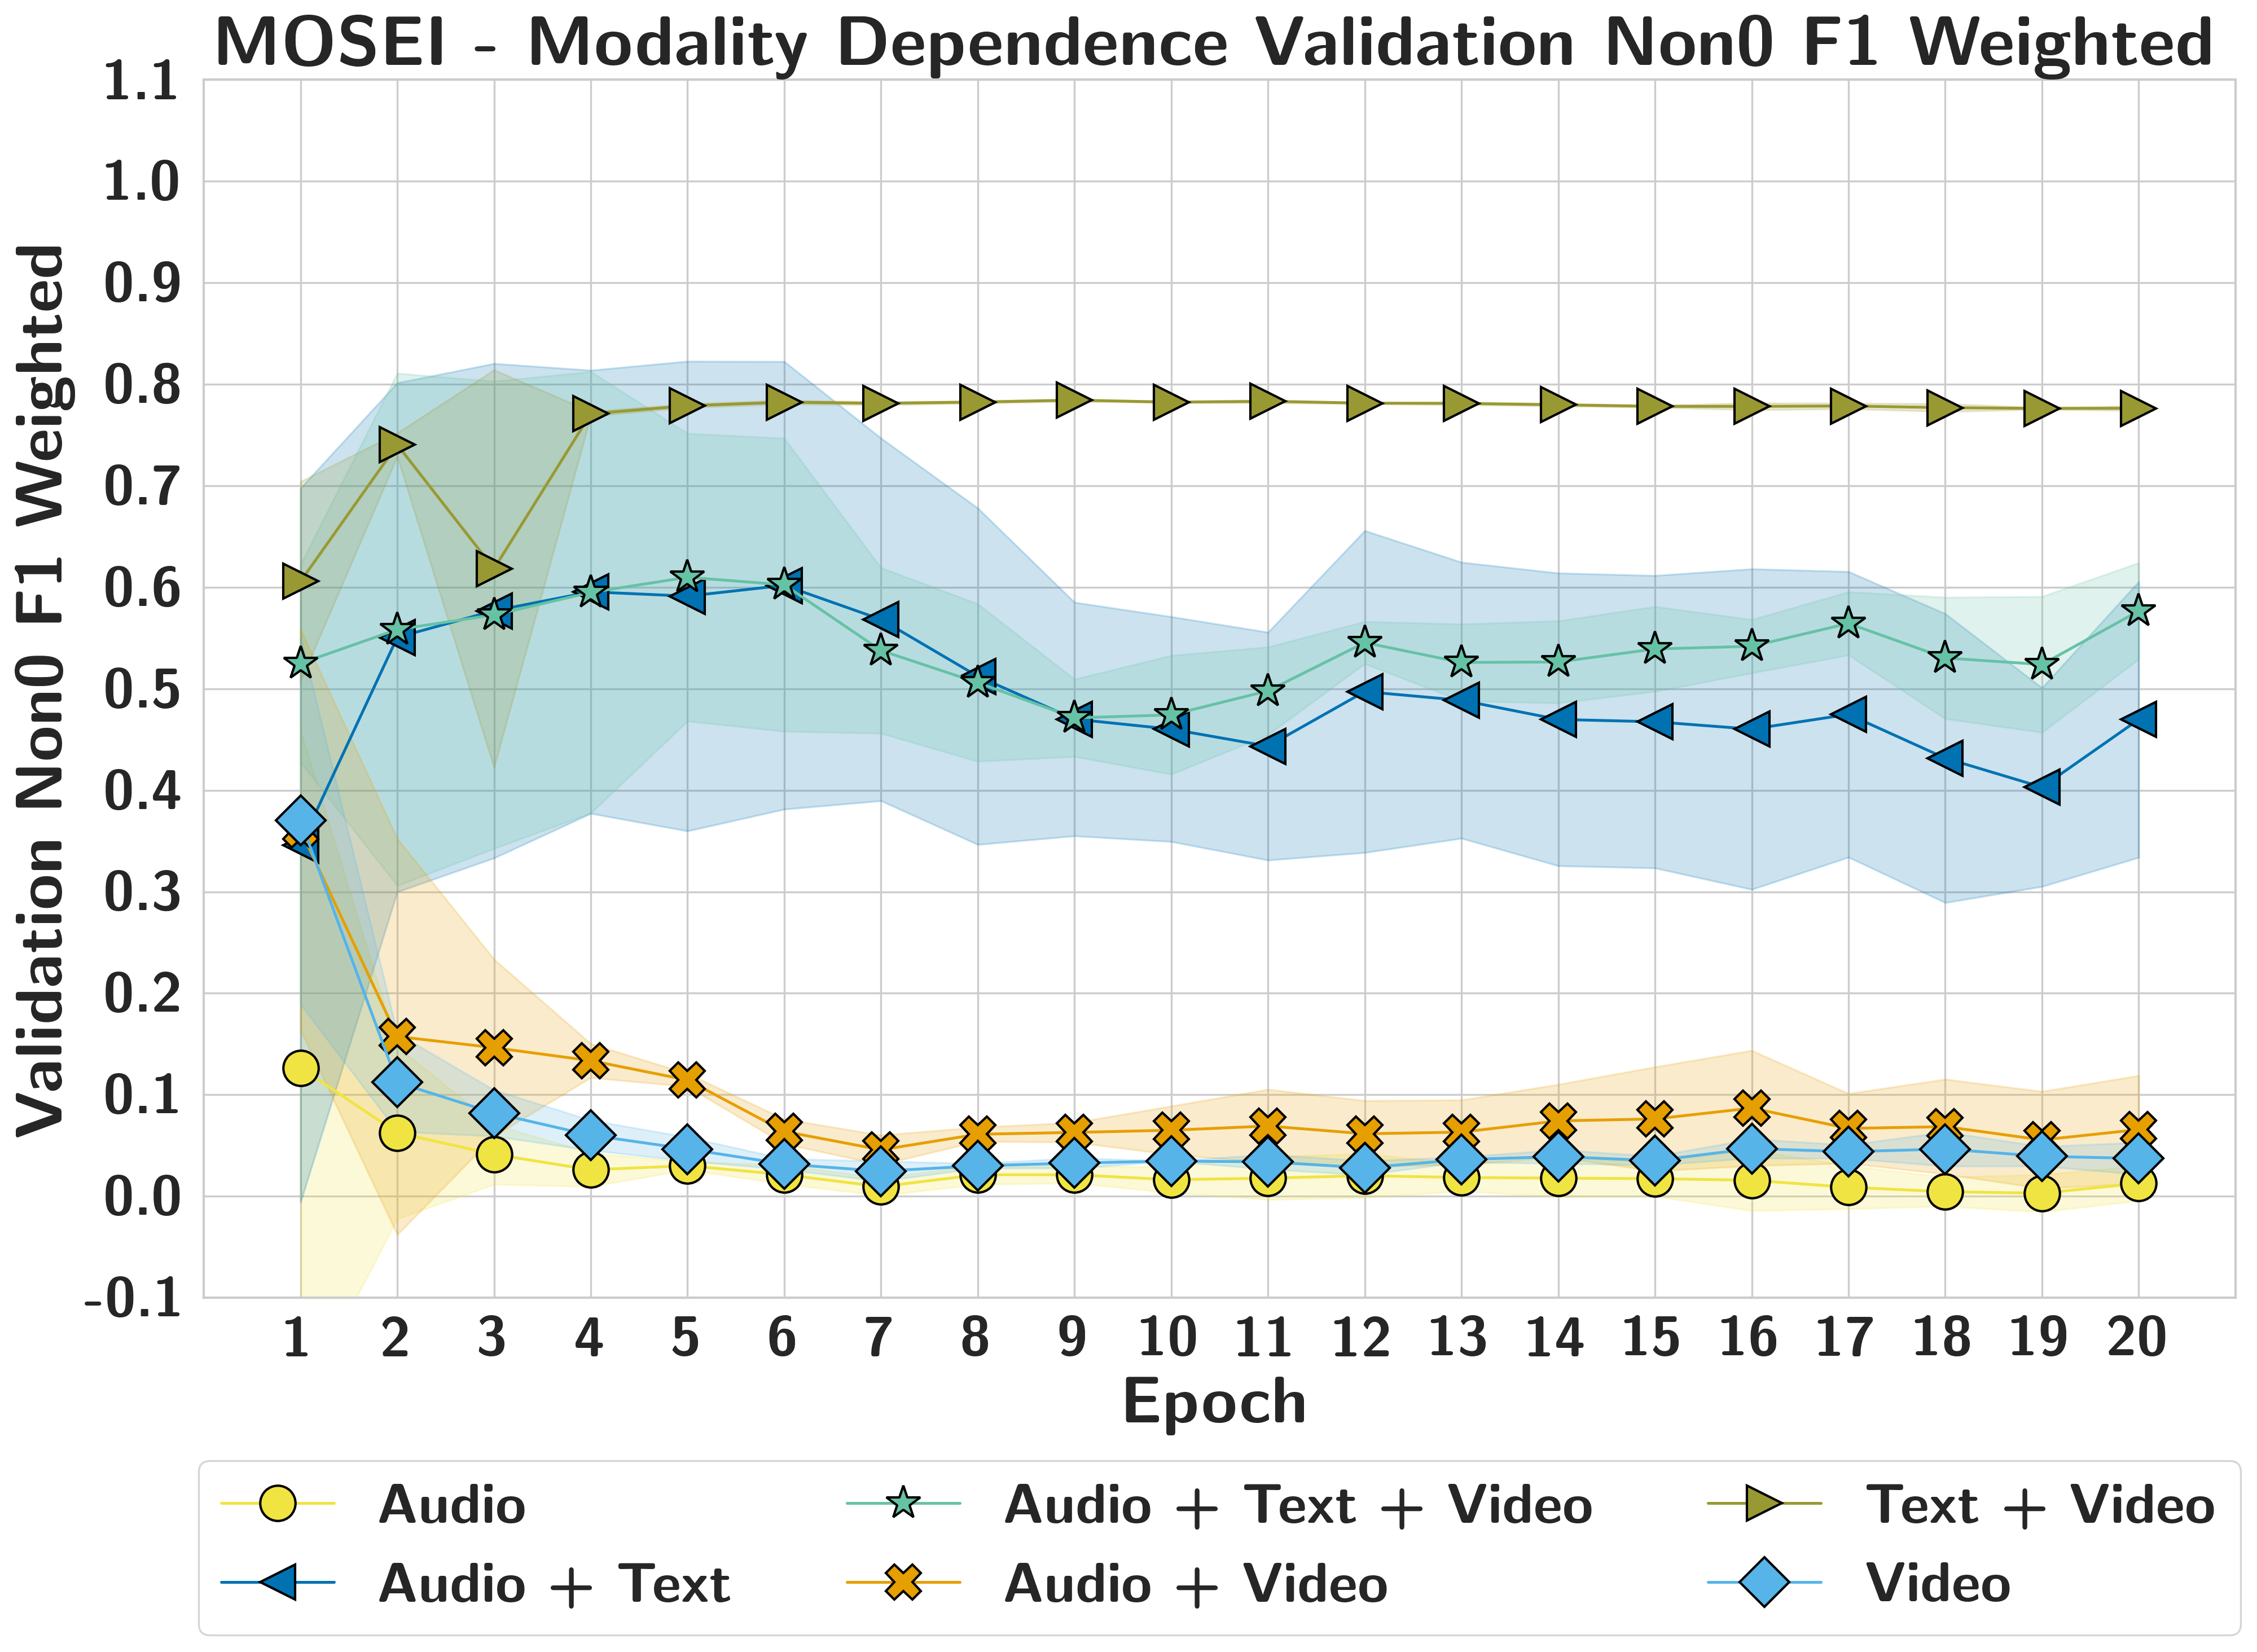
RQ1.3 — Can dependence be anticipated?
Yes, but not from raw validation alone: modality dependence emerges early in training and remains broadly stable, while unimodal validation can misrepresent true reliance.
AVMNISTEarly Lock-in
Image dependence appears within the first few epochs and remains consistently higher than audio, even when both unimodal metrics improve.
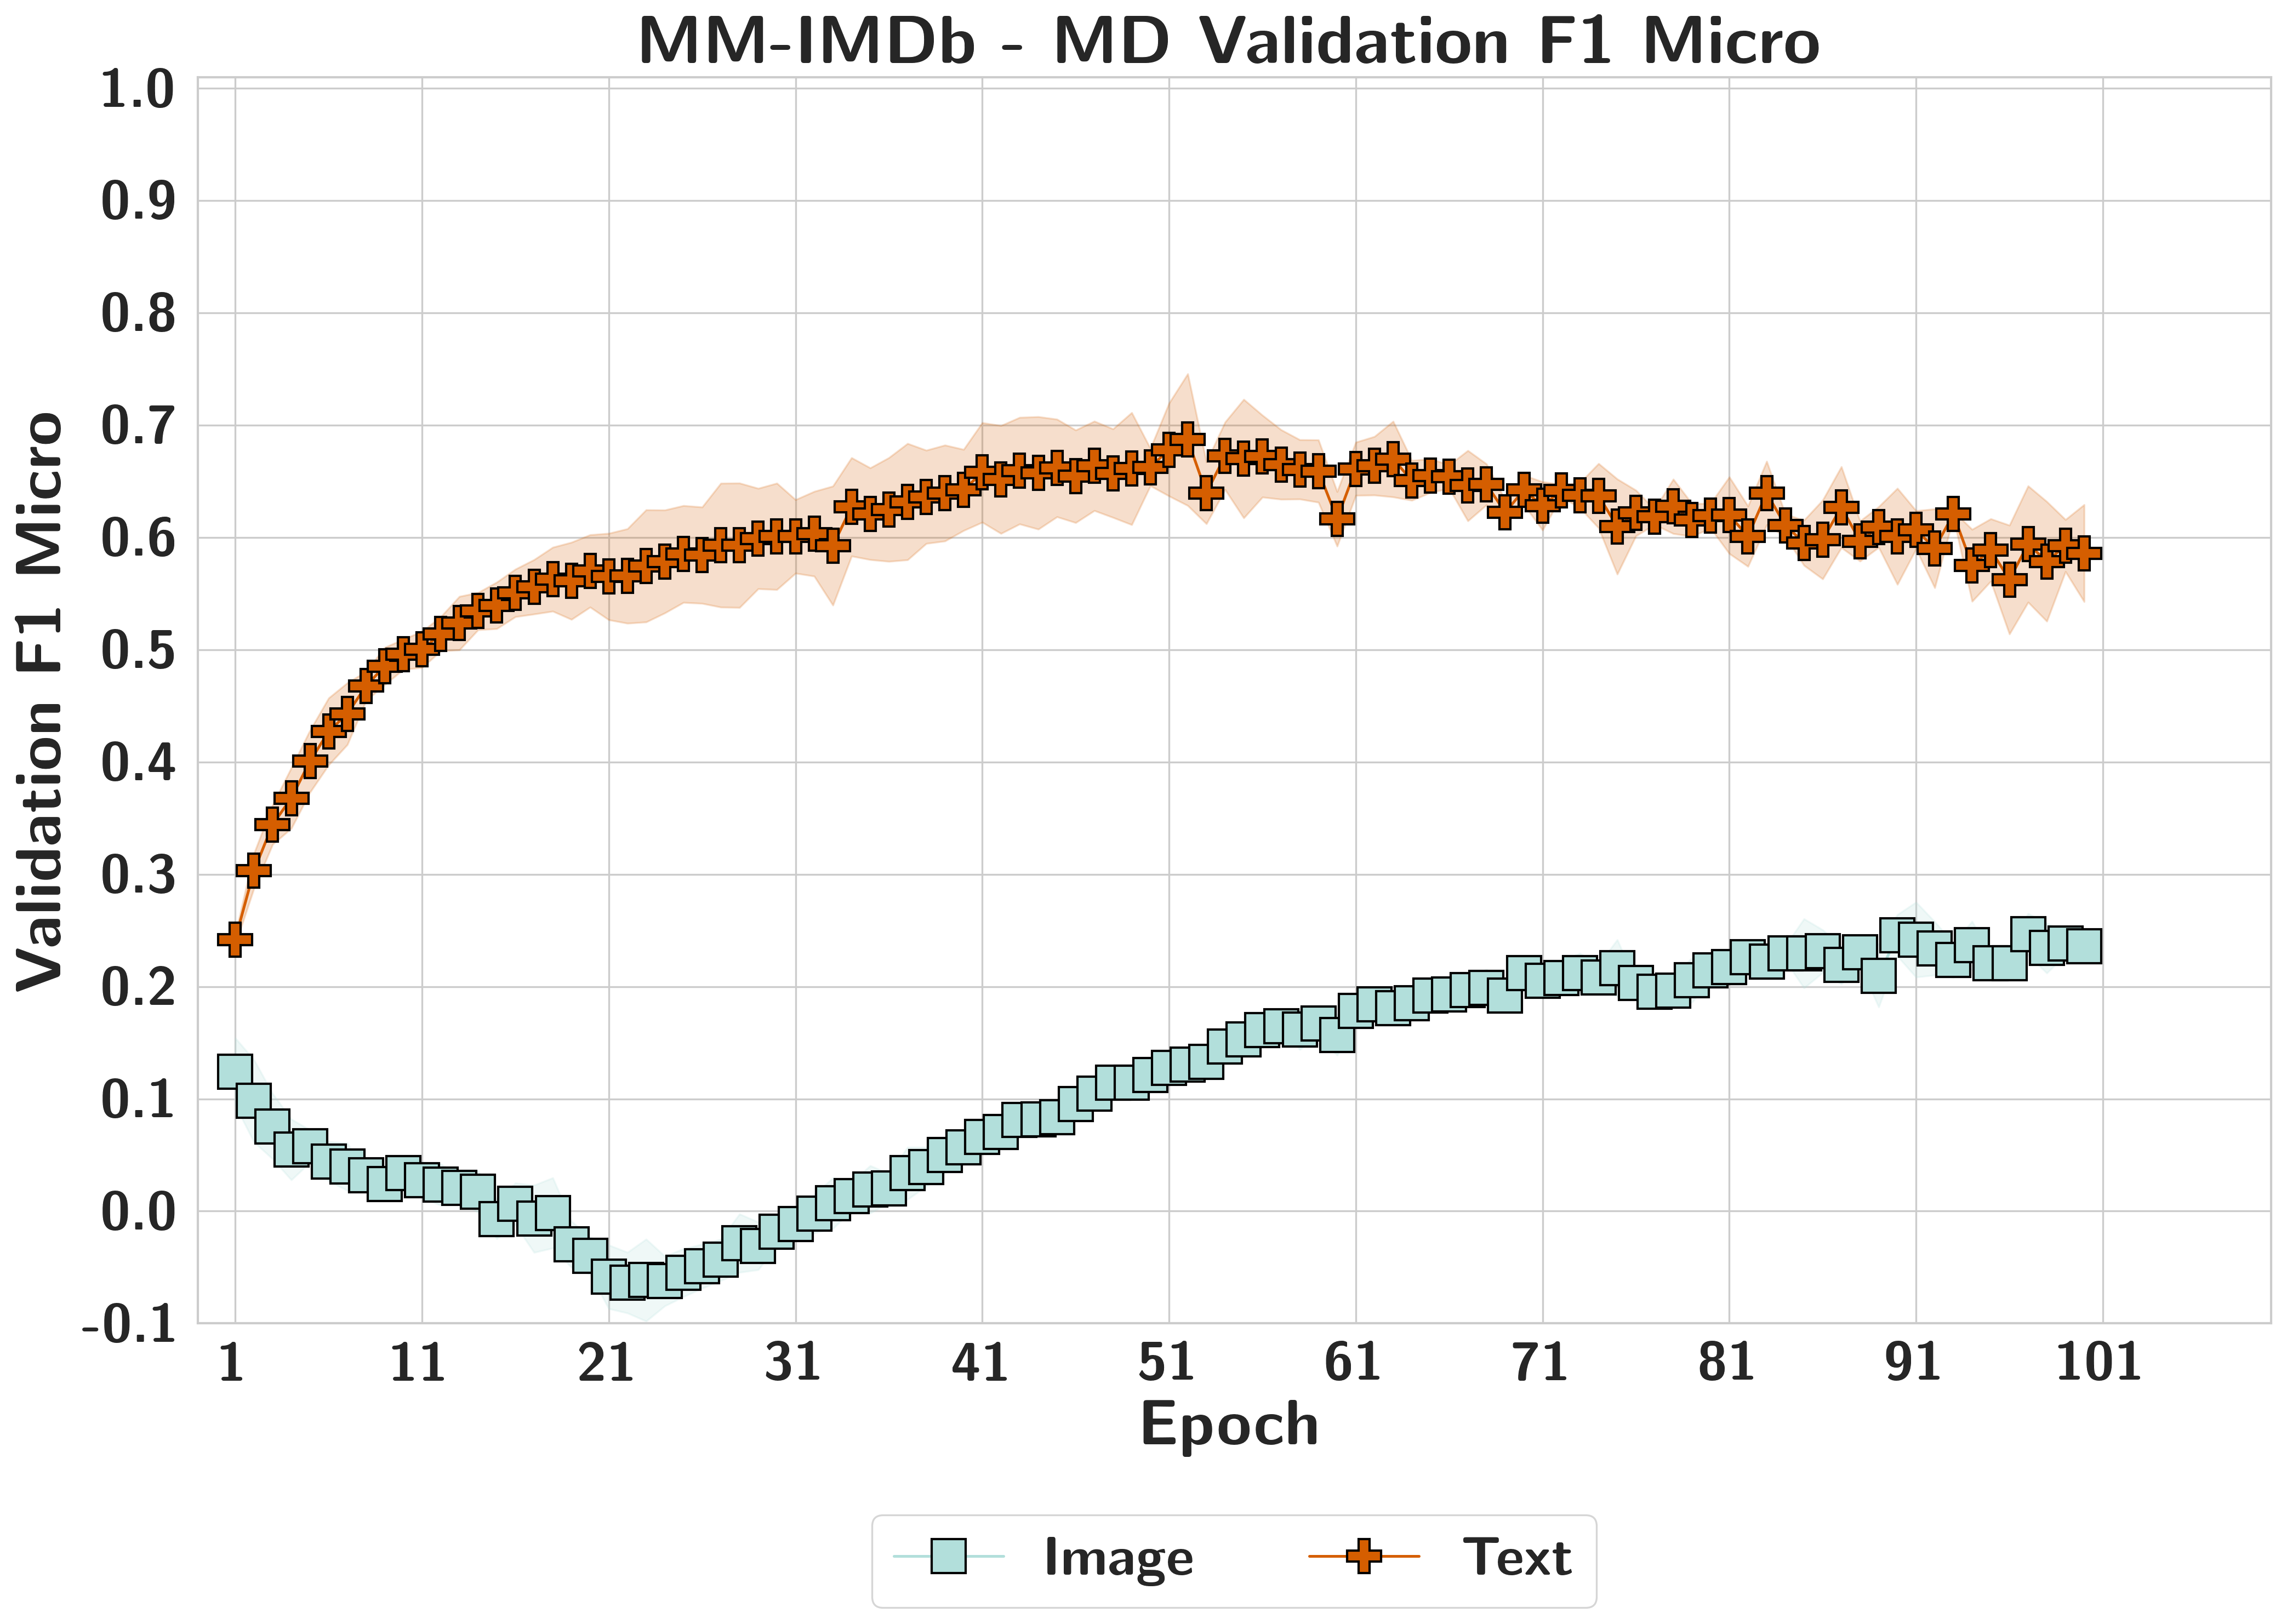
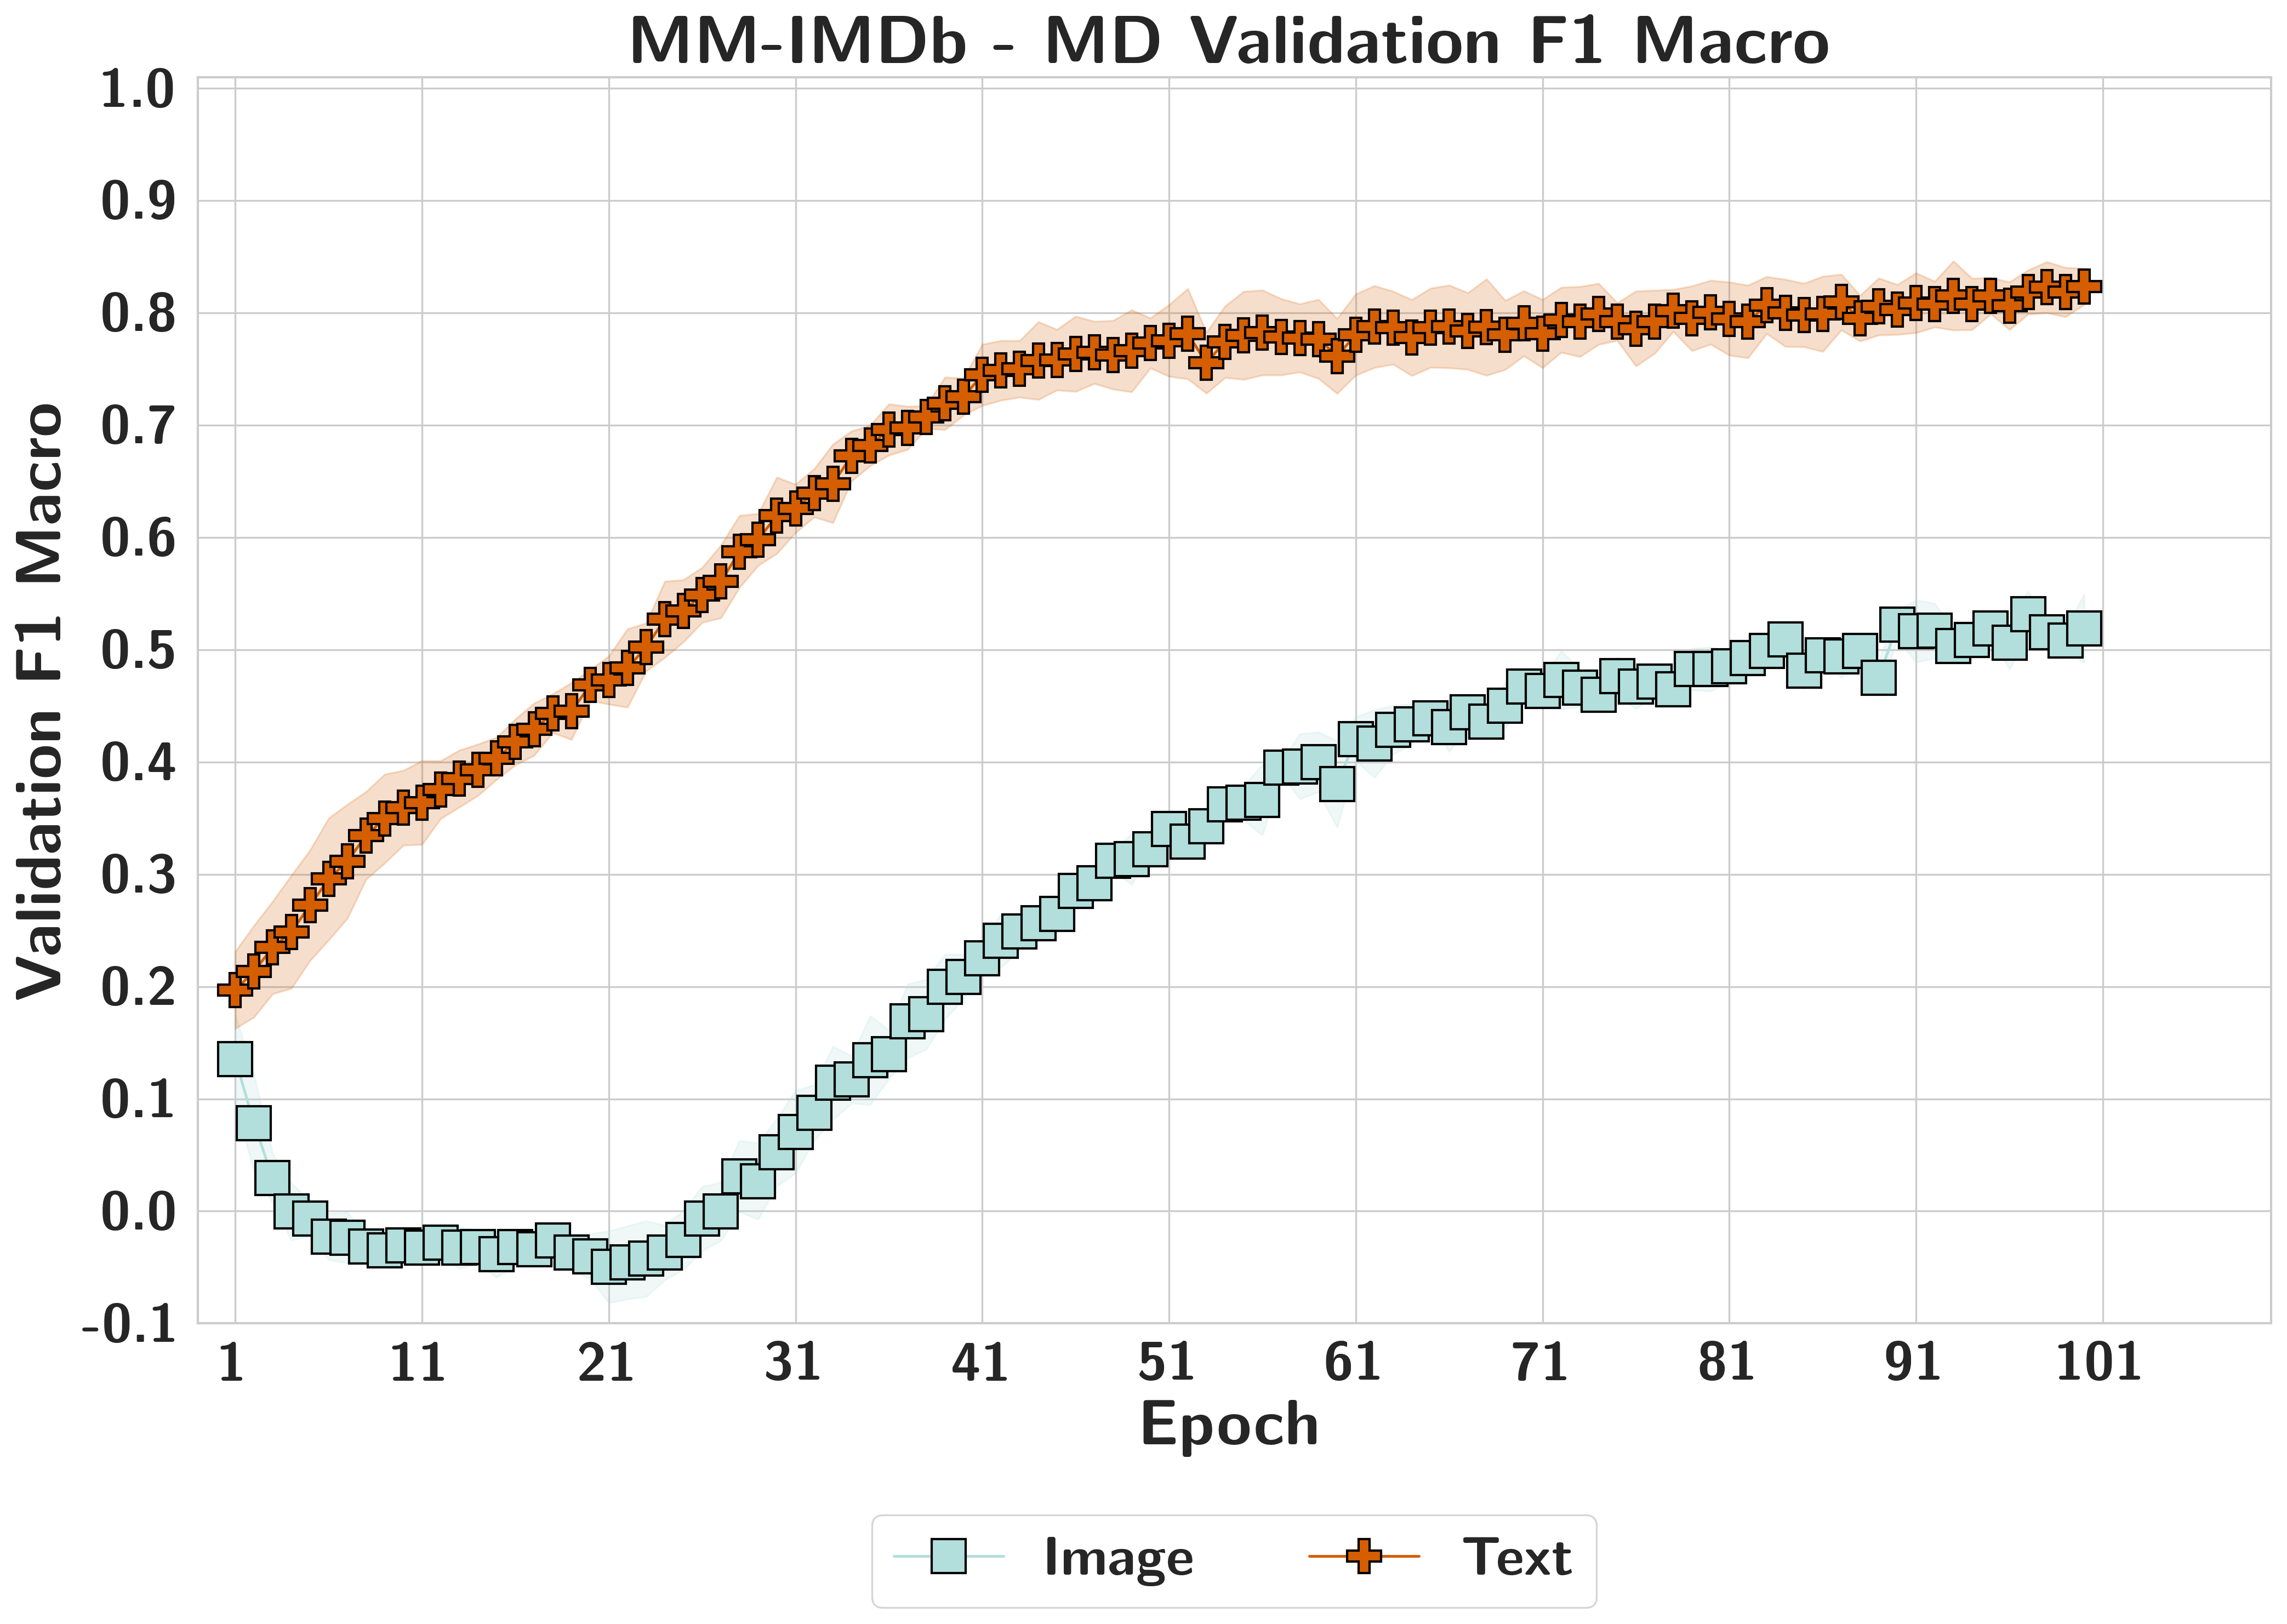
MM-IMDbText Dominant
Both modalities begin comparably, then text quickly comes to dominate; partial rebalancing appears later, but validation F1 alone does not reveal how much the full model still relies on text.
MOSEIDeceptive Metrics
Audio-only and video-only can show moderate early performance, yet dependence remains low; text alone shows rising and sustained functional importance.
What this shows
Modality dependence emerges as a stable trajectory early in training, well before convergence.
Standard validation metrics miss this; a modality can appear performant while being effectively redundant in the multimodal context.
Why it matters
Dependence can be diagnosed during training, not just tested after it.
Early detection creates a window to intervene before over-reliance on a single modality becomes structural.
RQ1 synthesis
RQ1 — Modality Absence and Behavioural DegradationSynthesis
RQ1 synthesis
How and to what extent does model performance change when an entire modality is unavailable at inference time, and how reliably can this change be anticipated?
Resolved Sub-Questions
RQ1.1
How closely do MM-SHAP contributions align with accuracy drop, confidence change, and calibration shift once the modality is gone?
They do not align reliably: attribution under full input often diverges from functional dependence under removal.
RQ1.2
Does Gaussian noise masking improve, worsen, or leave unchanged the baseline drop observed with zero masking?
There is no consistent winner: zero and Gaussian masking can produce different, sometimes opposing, behaviours across datasets.
RQ1.3
Can validation-time indicators or MM-SHAP contributions predict a model's dependence on a modality before removal?
Yes, but only partially: dependence emerges early and remains stable, yet raw validation behaviour alone can be misleading.
Answer to RQ1
Multimodal models show substantial, asymmetric degradation when a modality is removed, and this behavior cannot be reliably predicted by attribution tools like MM-SHAP, which conflates representational participation with functional dependence.
Failures are non-random and masking-strategy-dependent, yet traceable to stable behavioral trajectories established early in training.
Transition
Fragility is established.
Can we fix it? Yes, we can!
RQ2 — Post Hoc Modular Reconstruction
RQ2 — Post Hoc Modular ReconstructionRQ2
Research question
To what extent can a modular, lightweight, and post-training feature reconstruction approach mitigate performance degradation caused by fully missing modalities during multimodal model inference?
— Published in ACM Transactions on Intelligent Systems and Technology (2025)
Sub-questions
RQ2.1
How does varying the amount of available training data affect the reconstruction capabilities and inference performance of C-MAMs?
RQ2.2
To what extent does the complexity of the chosen loss function influence the quality of modality embedding reconstruction and subsequent inference performance?
RQ2.3
How does fine-tuning pre-trained modality-specific encoders during C-MAM training influence inference-time reconstruction performance?
RQ2.4
What is the relationship between the quality of reconstructed modality embeddings and the degree of performance recovery achieved during inference?
RQ2.5
How do inherent modality interactions affect the capability of C-MAMs to reconstruct missing modality embeddings?
Approach
Train modular C-MAMs independently; systematically vary training data availabilityMinimum Training Requirements
Compare reconstruction objectives, including MSE and alternative lossesImpact of Loss Function on Reconstruction Quality
Evaluate frozen versus fine-tuned encoder configurationsThe Role of Modality-Specific Encoders in C-MAMs
Relate embedding reconstruction quality to downstream performance recoveryStatistical Analysis of Reconstructed Embeddings
Analyse how modality interactions influence reconstruction successContrastive Information in Multimodal Models
RQ2.1
RQ2 — Post Hoc Modular ReconstructionRQ2.1 Results
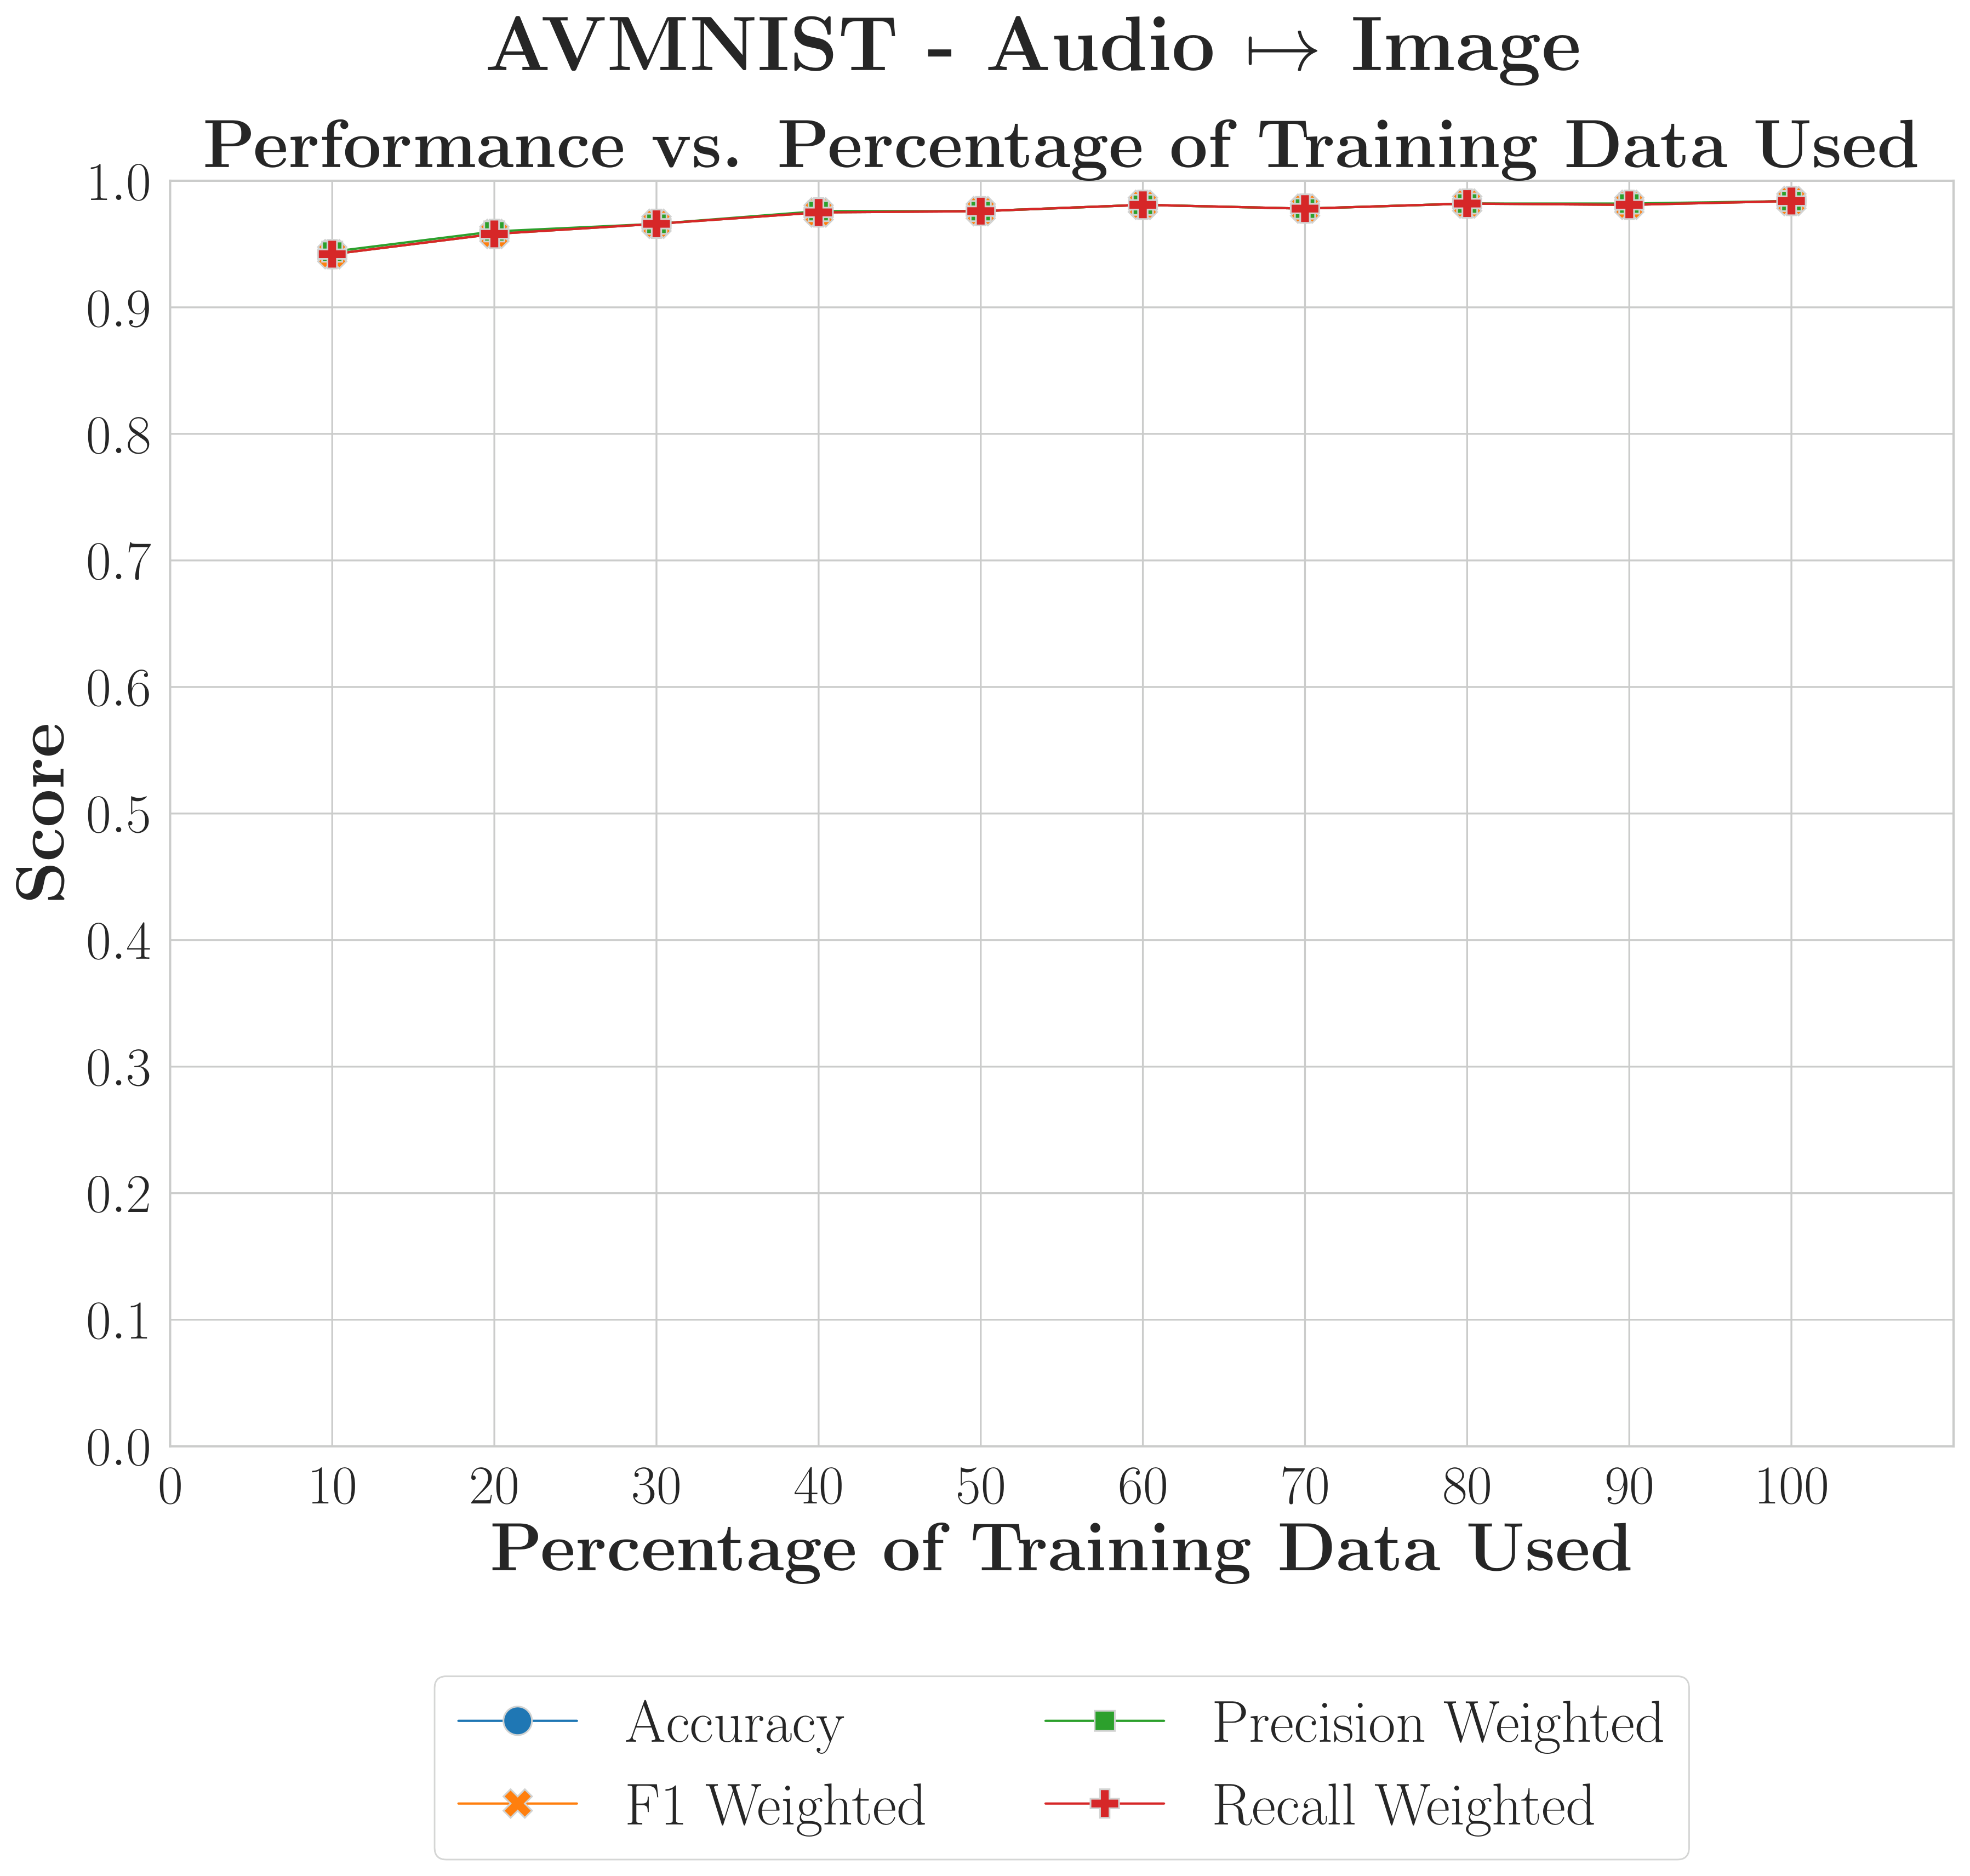
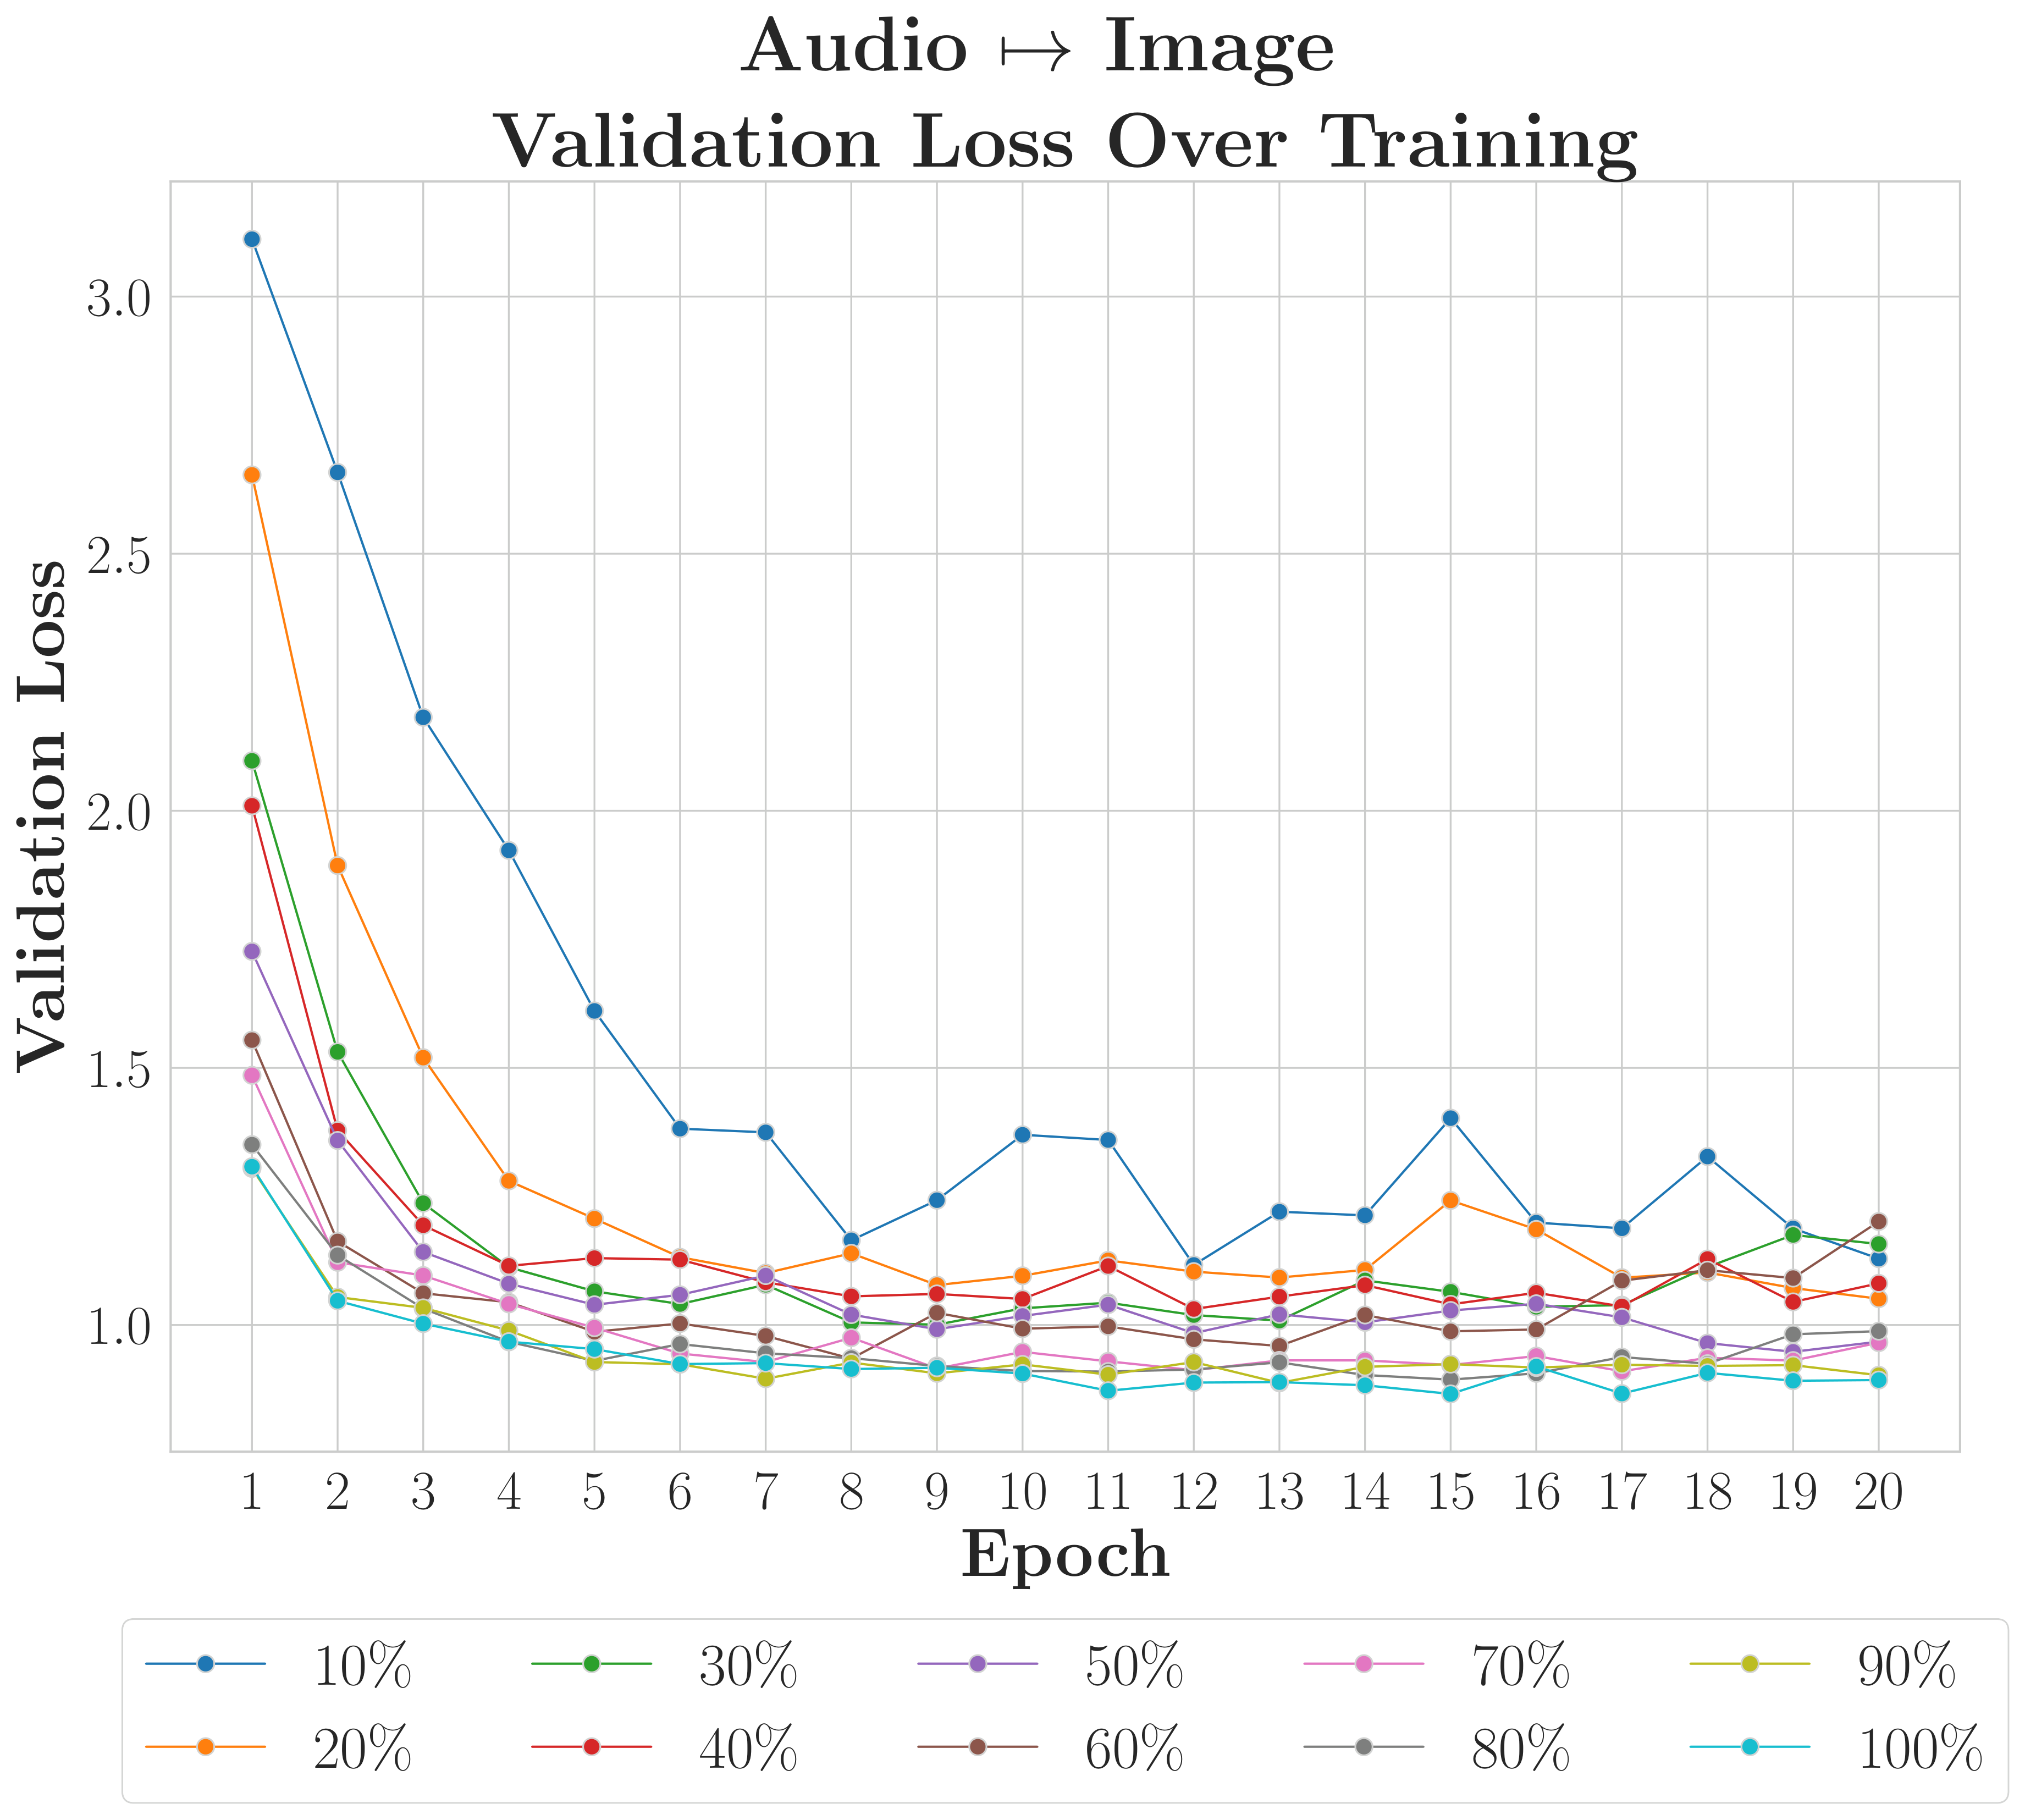
RQ2.1 — Training data availability
C-MAMs achieve strong recovery with as little as 10% of training data when inter-modality redundancy is high; weaker-structure reconstructions benefit from more data but remain viable with limited samples.
AVMNISTData Efficient
Training on just 10% of the dataset yields performance within 2–5% of the full-data baseline; the base model's latent space provides a robust foundation for mapping associations with minimal supervision.
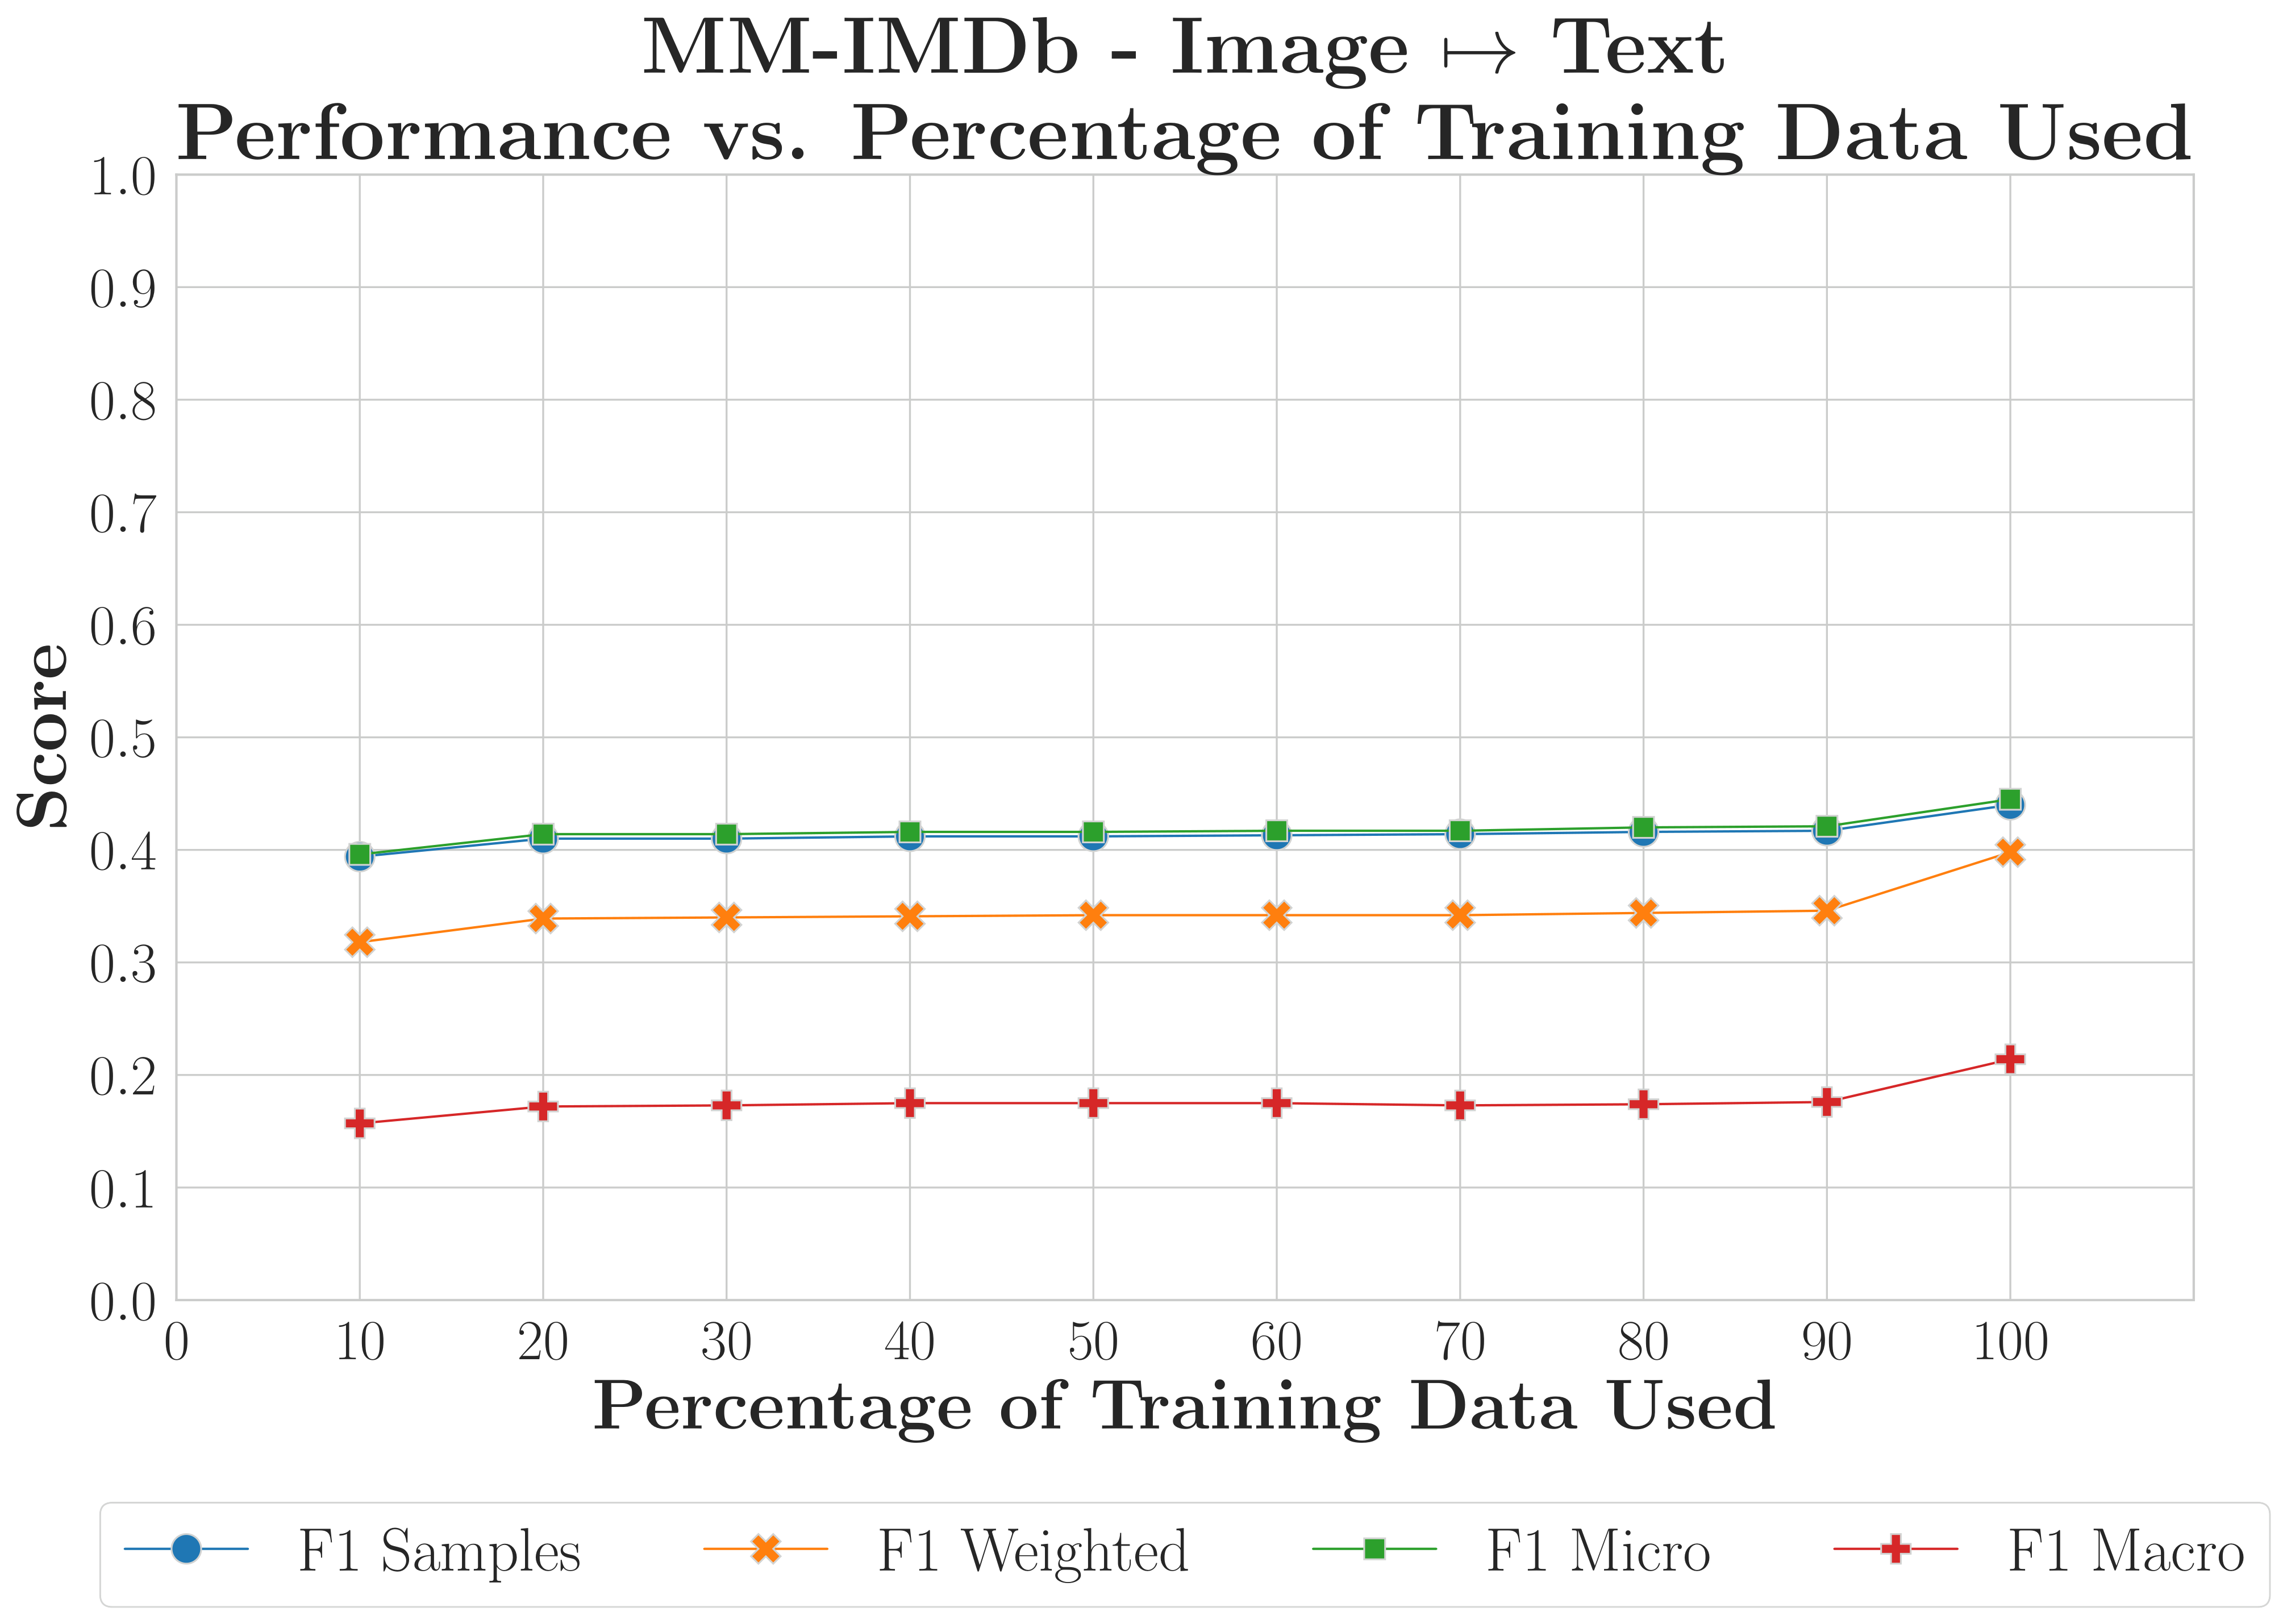
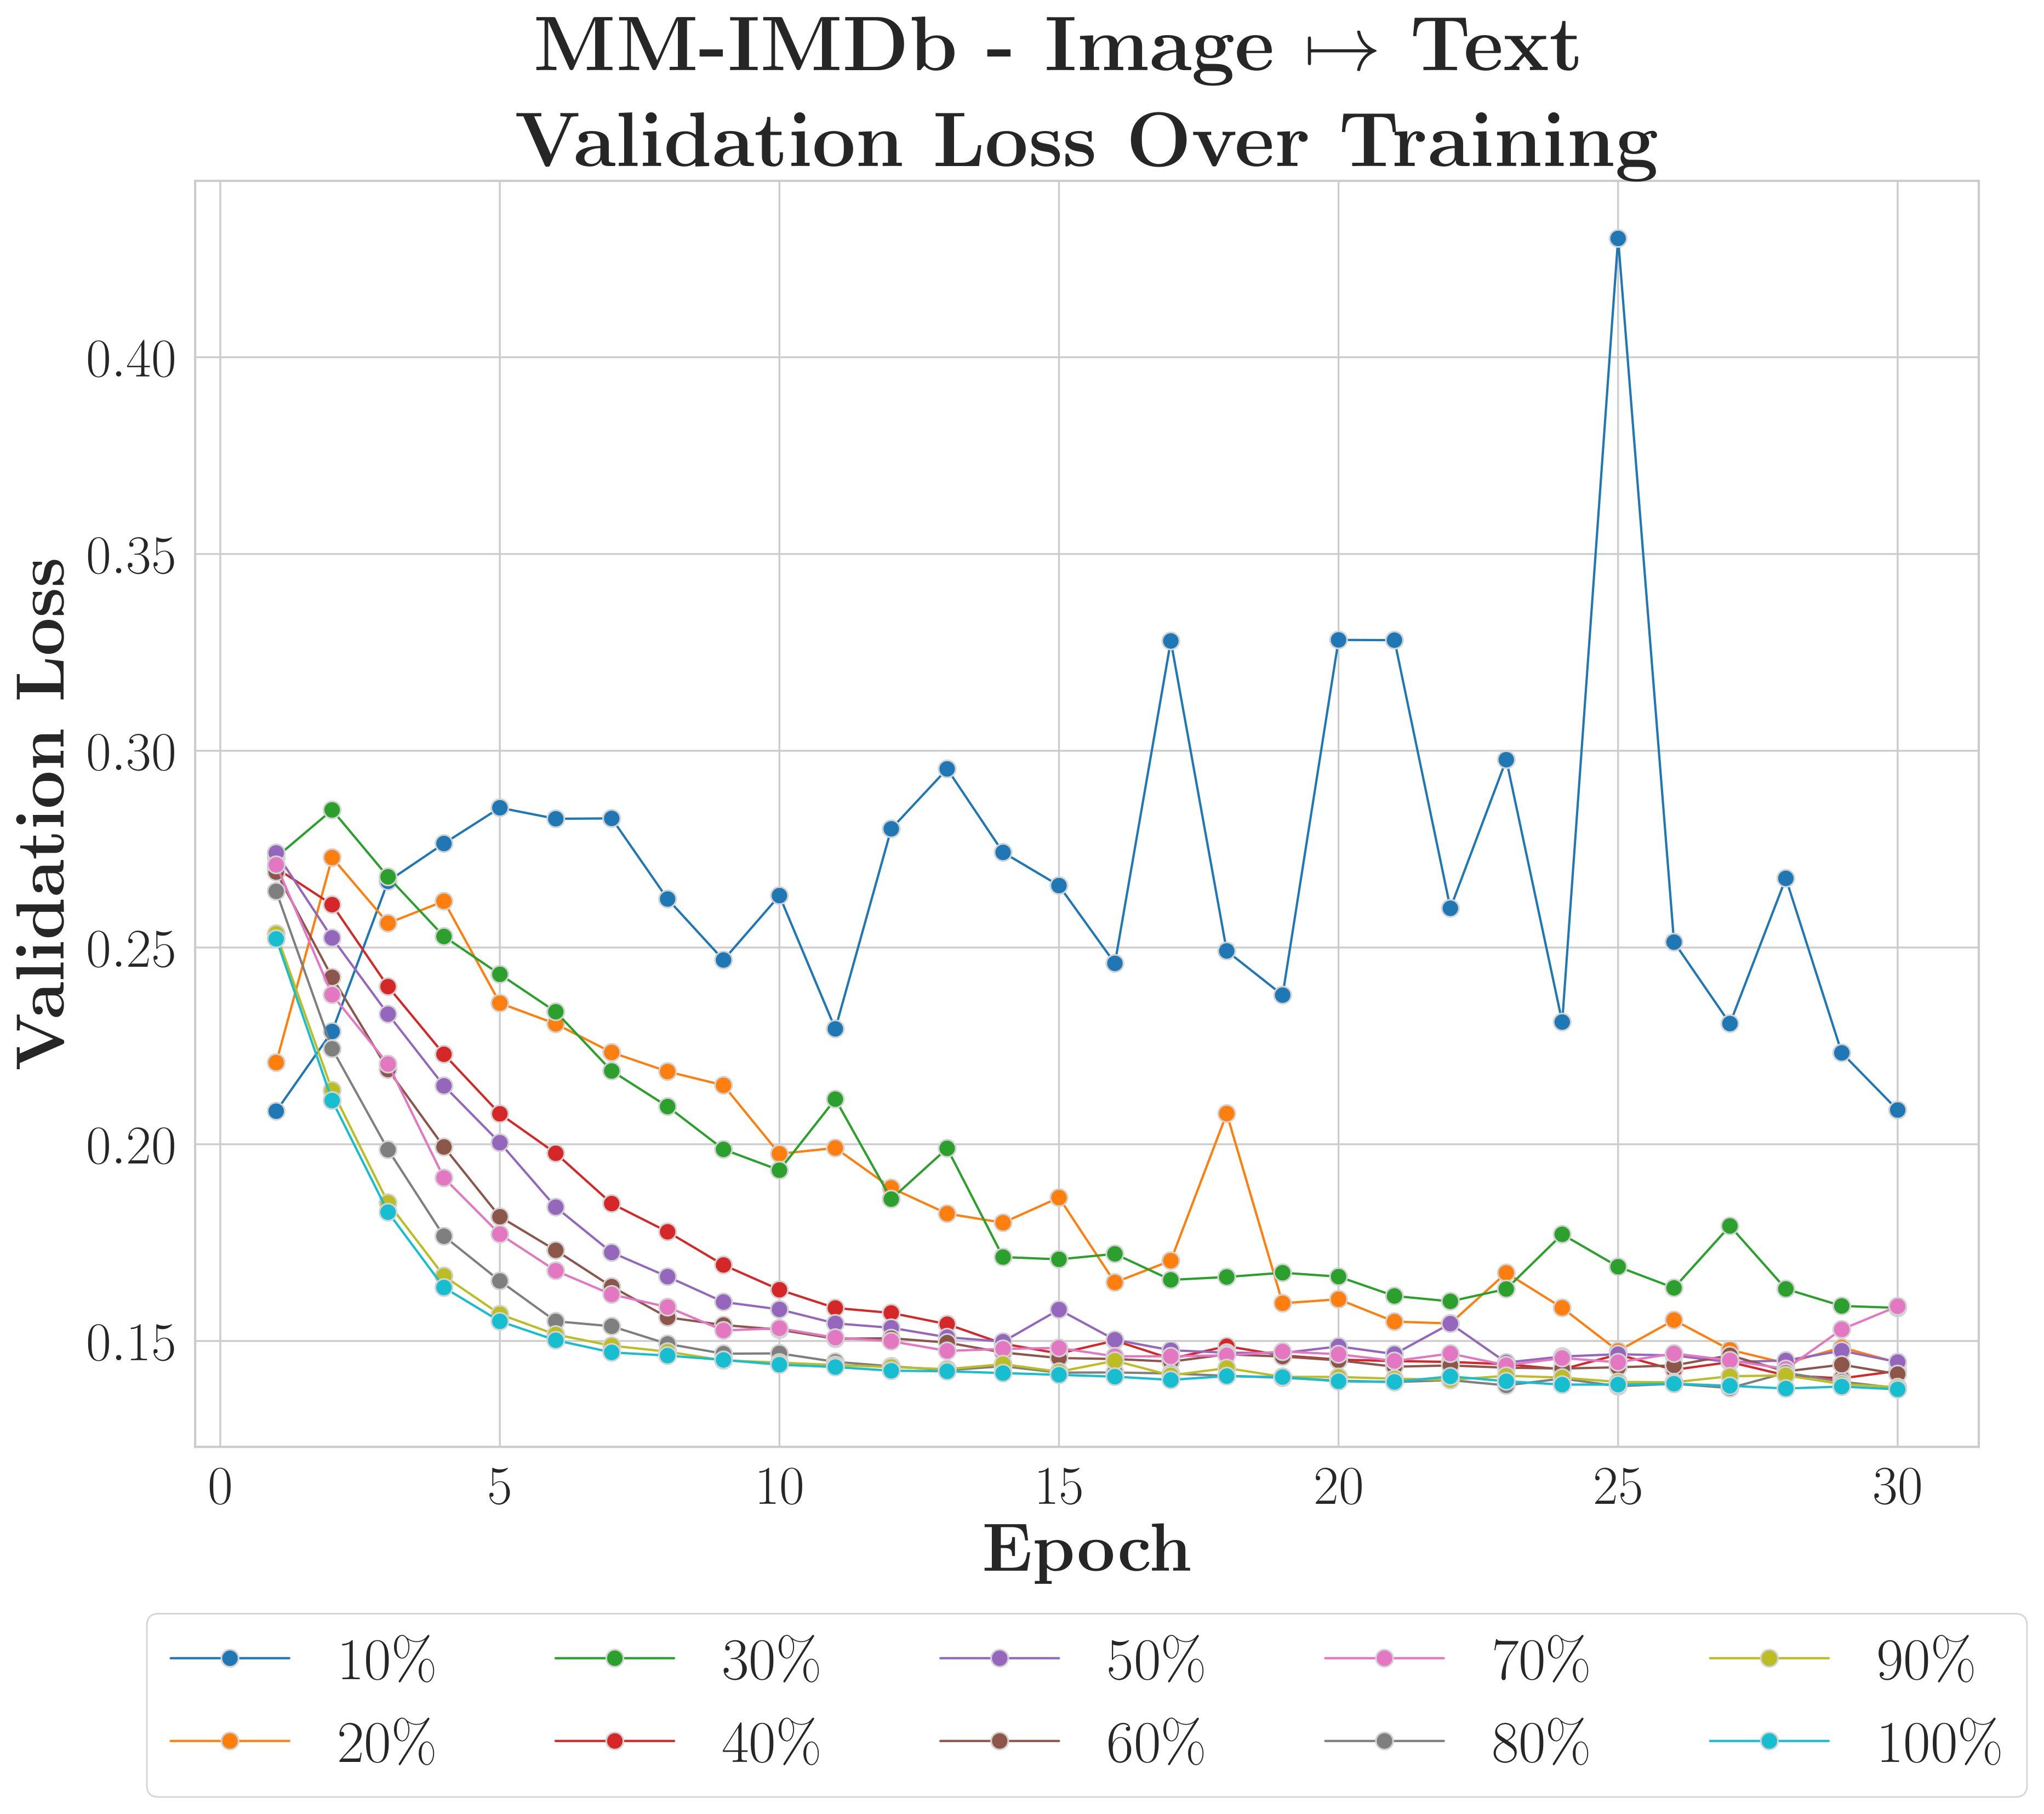
MM-IMDbHigher Variance
F1 scores within 10% of full-data baselines using only 10% of training samples, though using the weaker image modality as input introduces higher variance during early convergence.
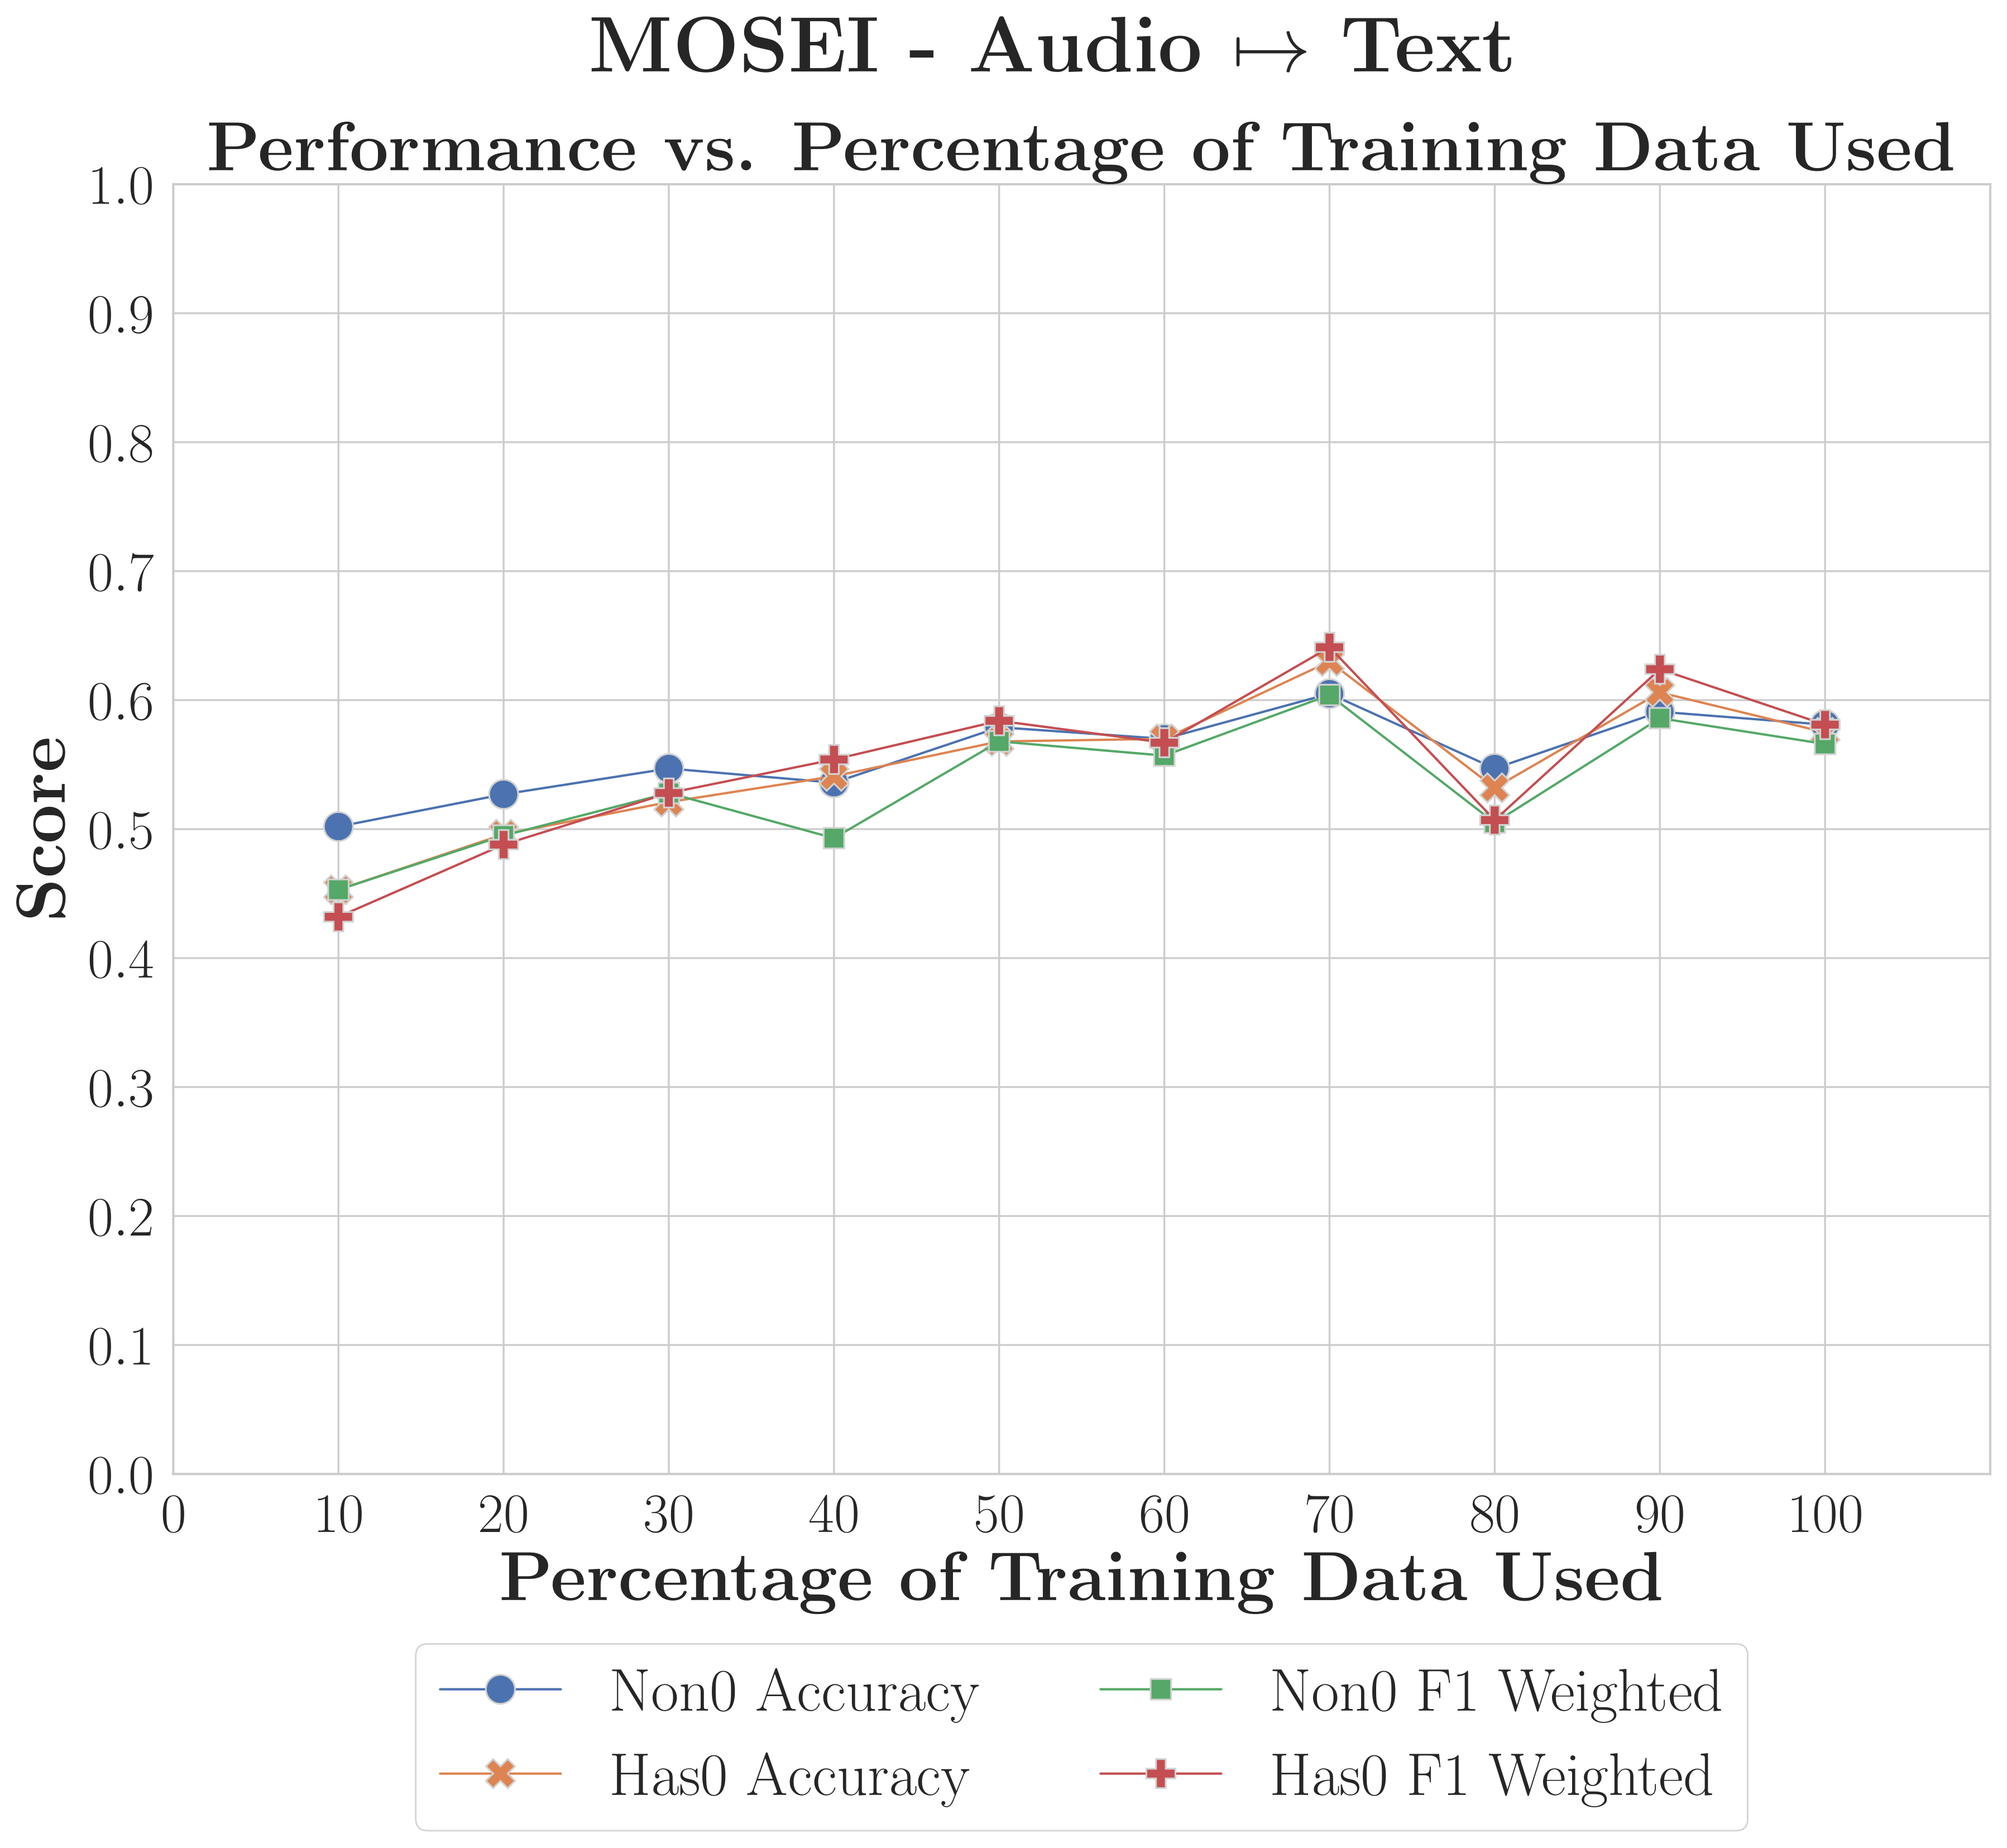
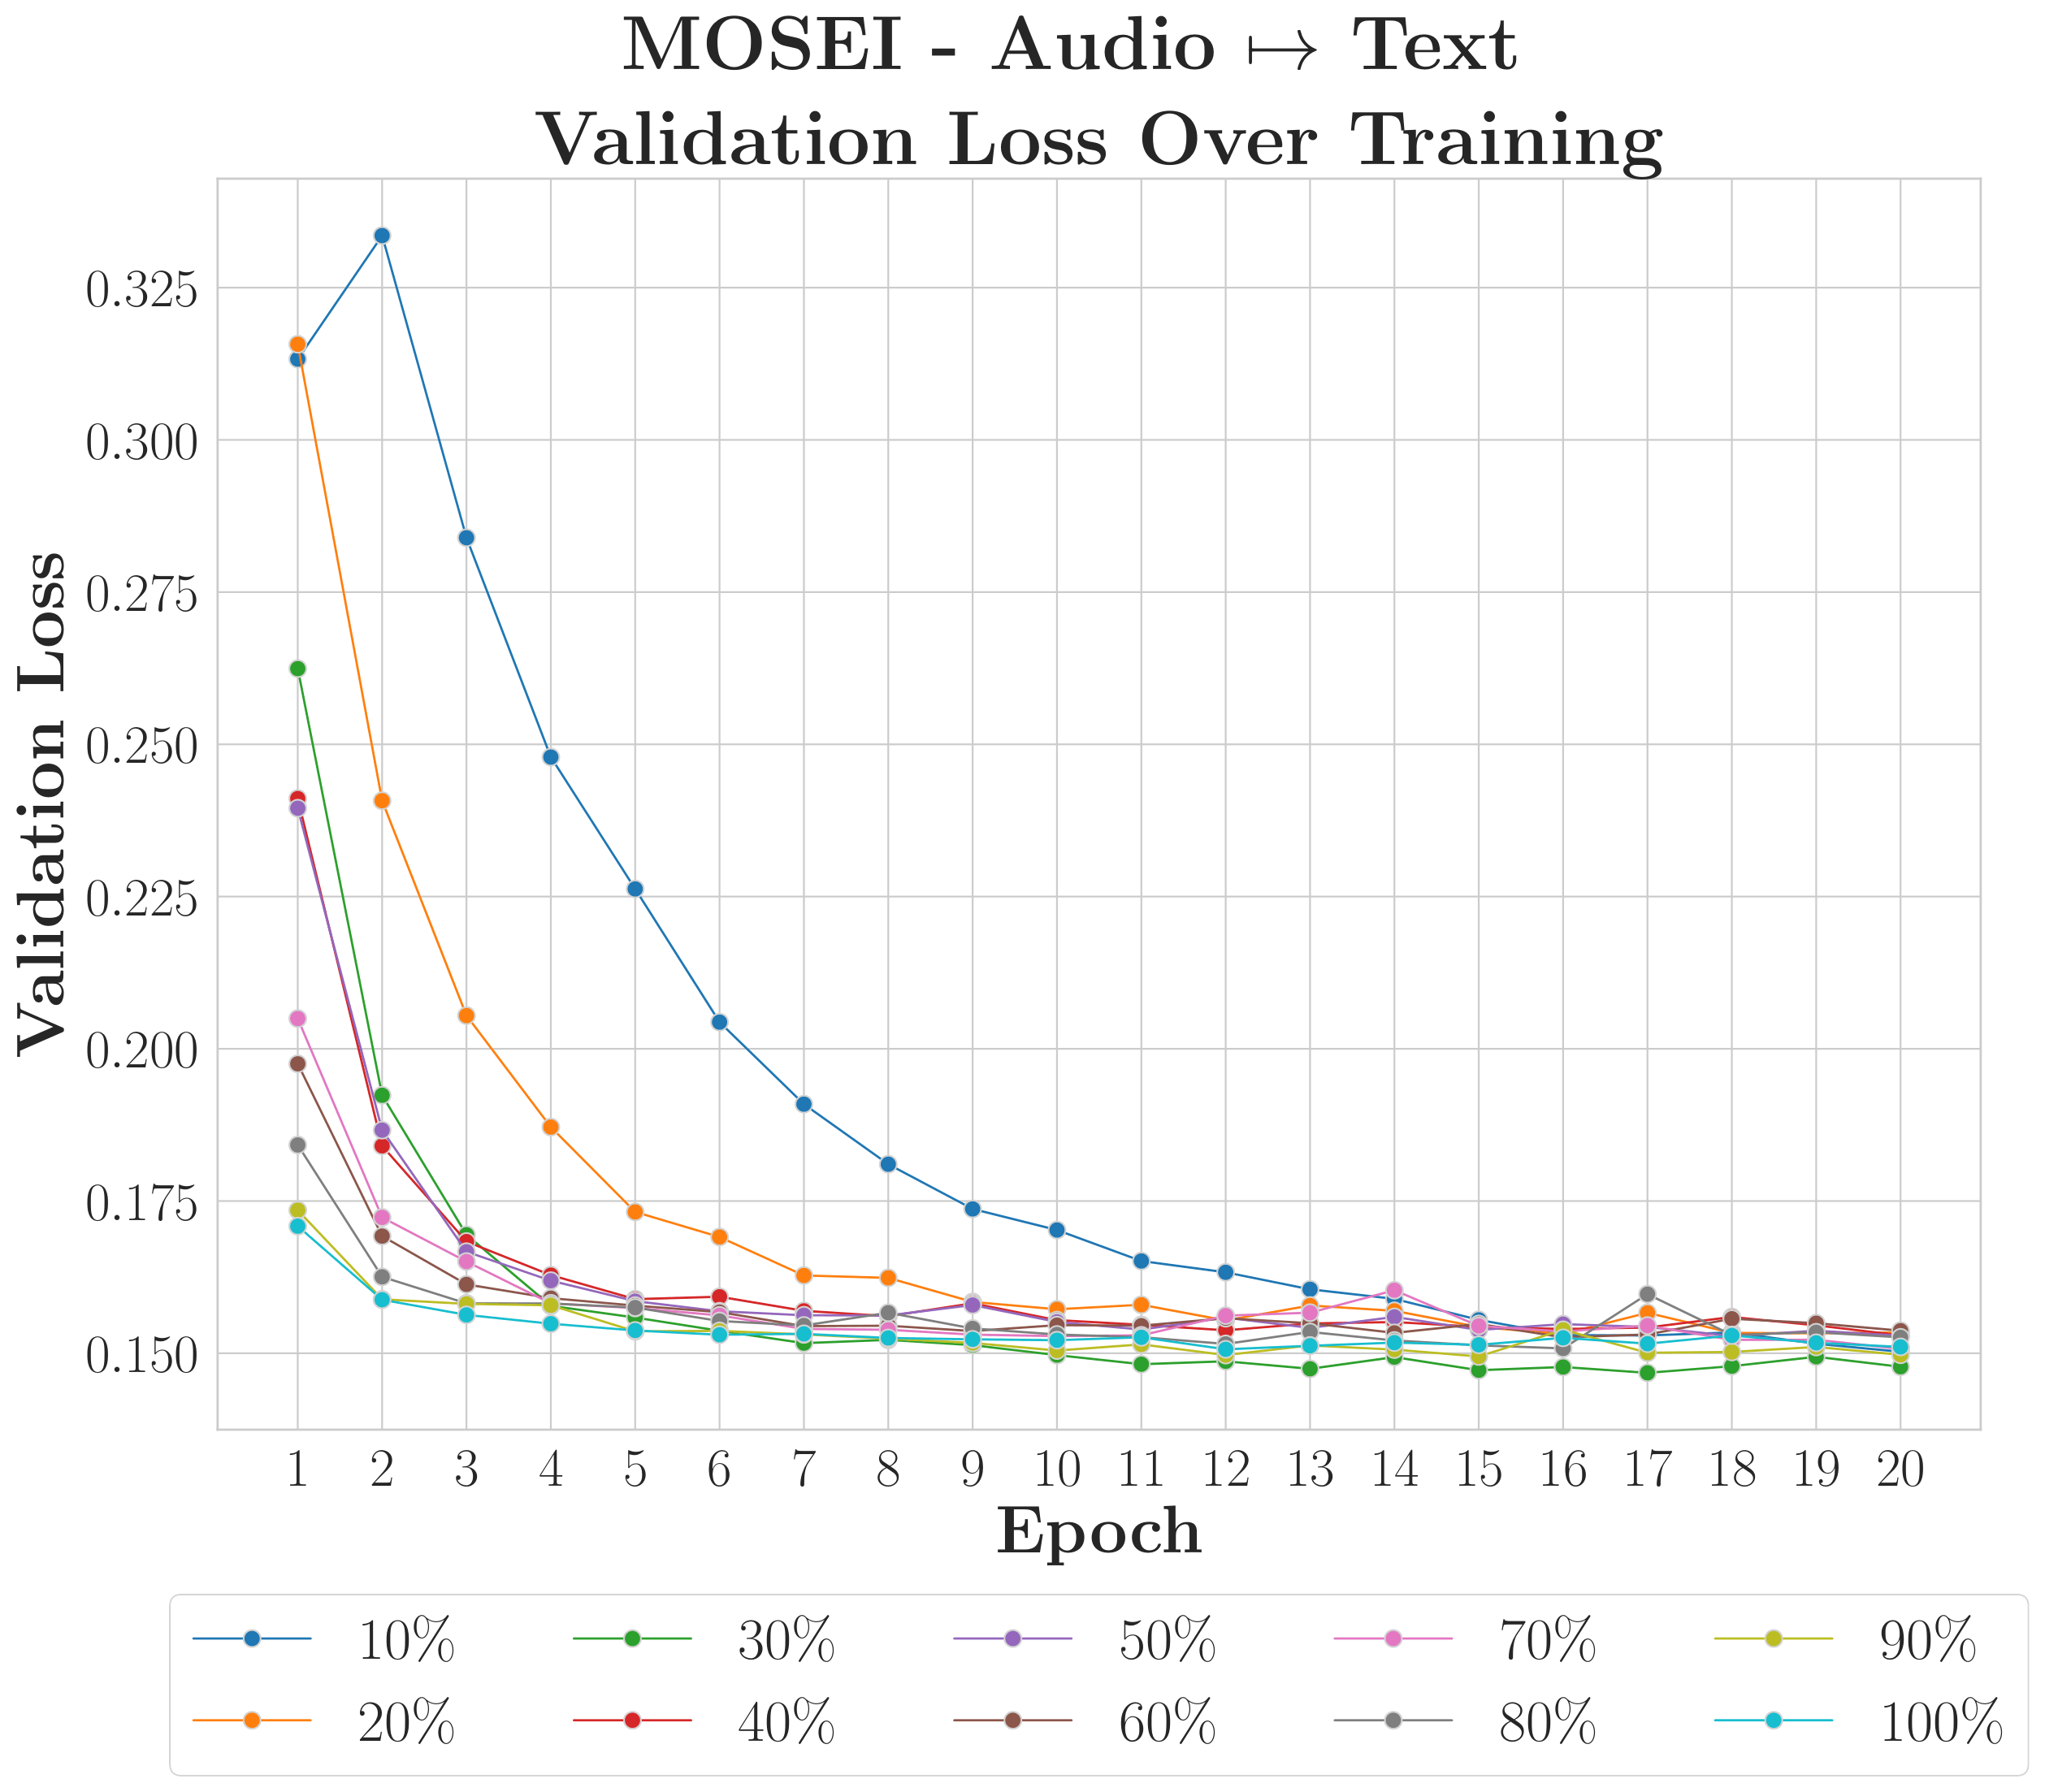
MOSEIModality Dependent
Text reconstruction remains robust even under severe data constraints, but the framework requires larger datasets to stabilise reconstruction for weaker modalities like audio and video.
What this shows
C-MAMs are data-efficient. Training on just 10% of available data keeps performance within 2–5% of the full-data baseline.
The base model's latent space provides the foundation, the C-MAM only needs to learn the associations between existing embeddings.
Why it matters
Low data requirements make C-MAMs viable in resource-constrained and privacy-sensitive deployments where large centralised datasets are not available.
RQ2.2
RQ2 — Post Hoc Modular ReconstructionRQ2.2 Results
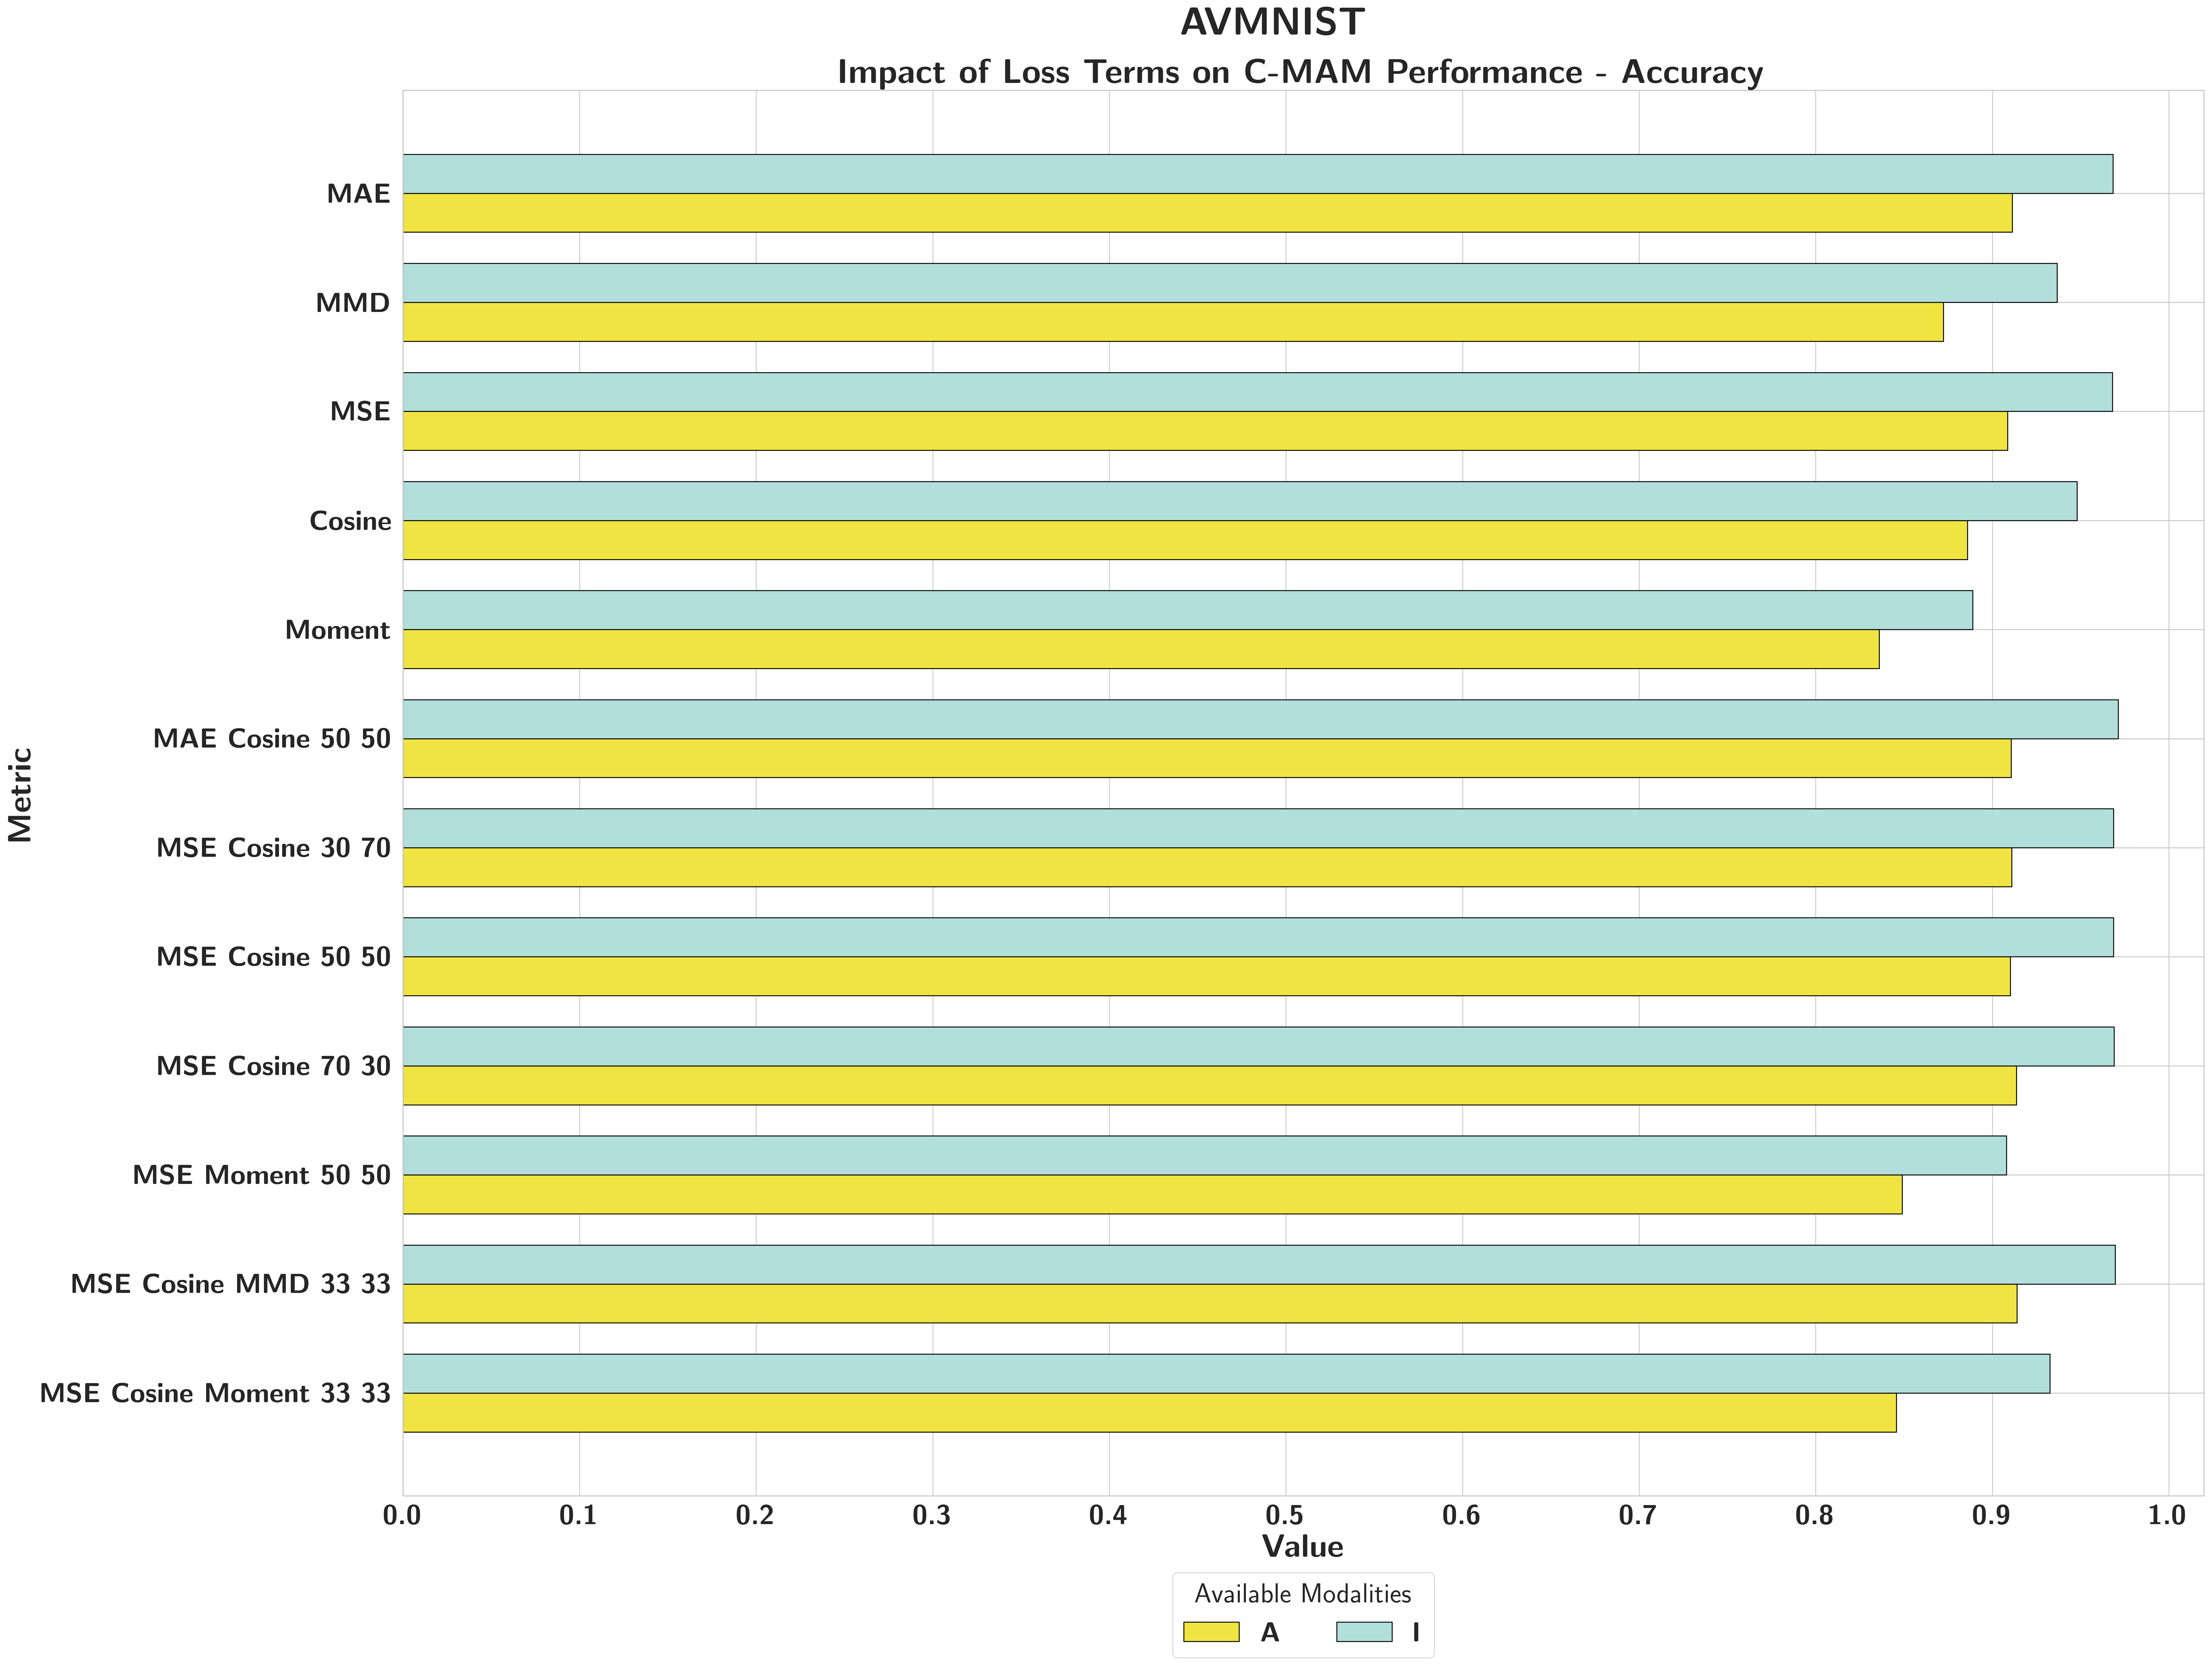
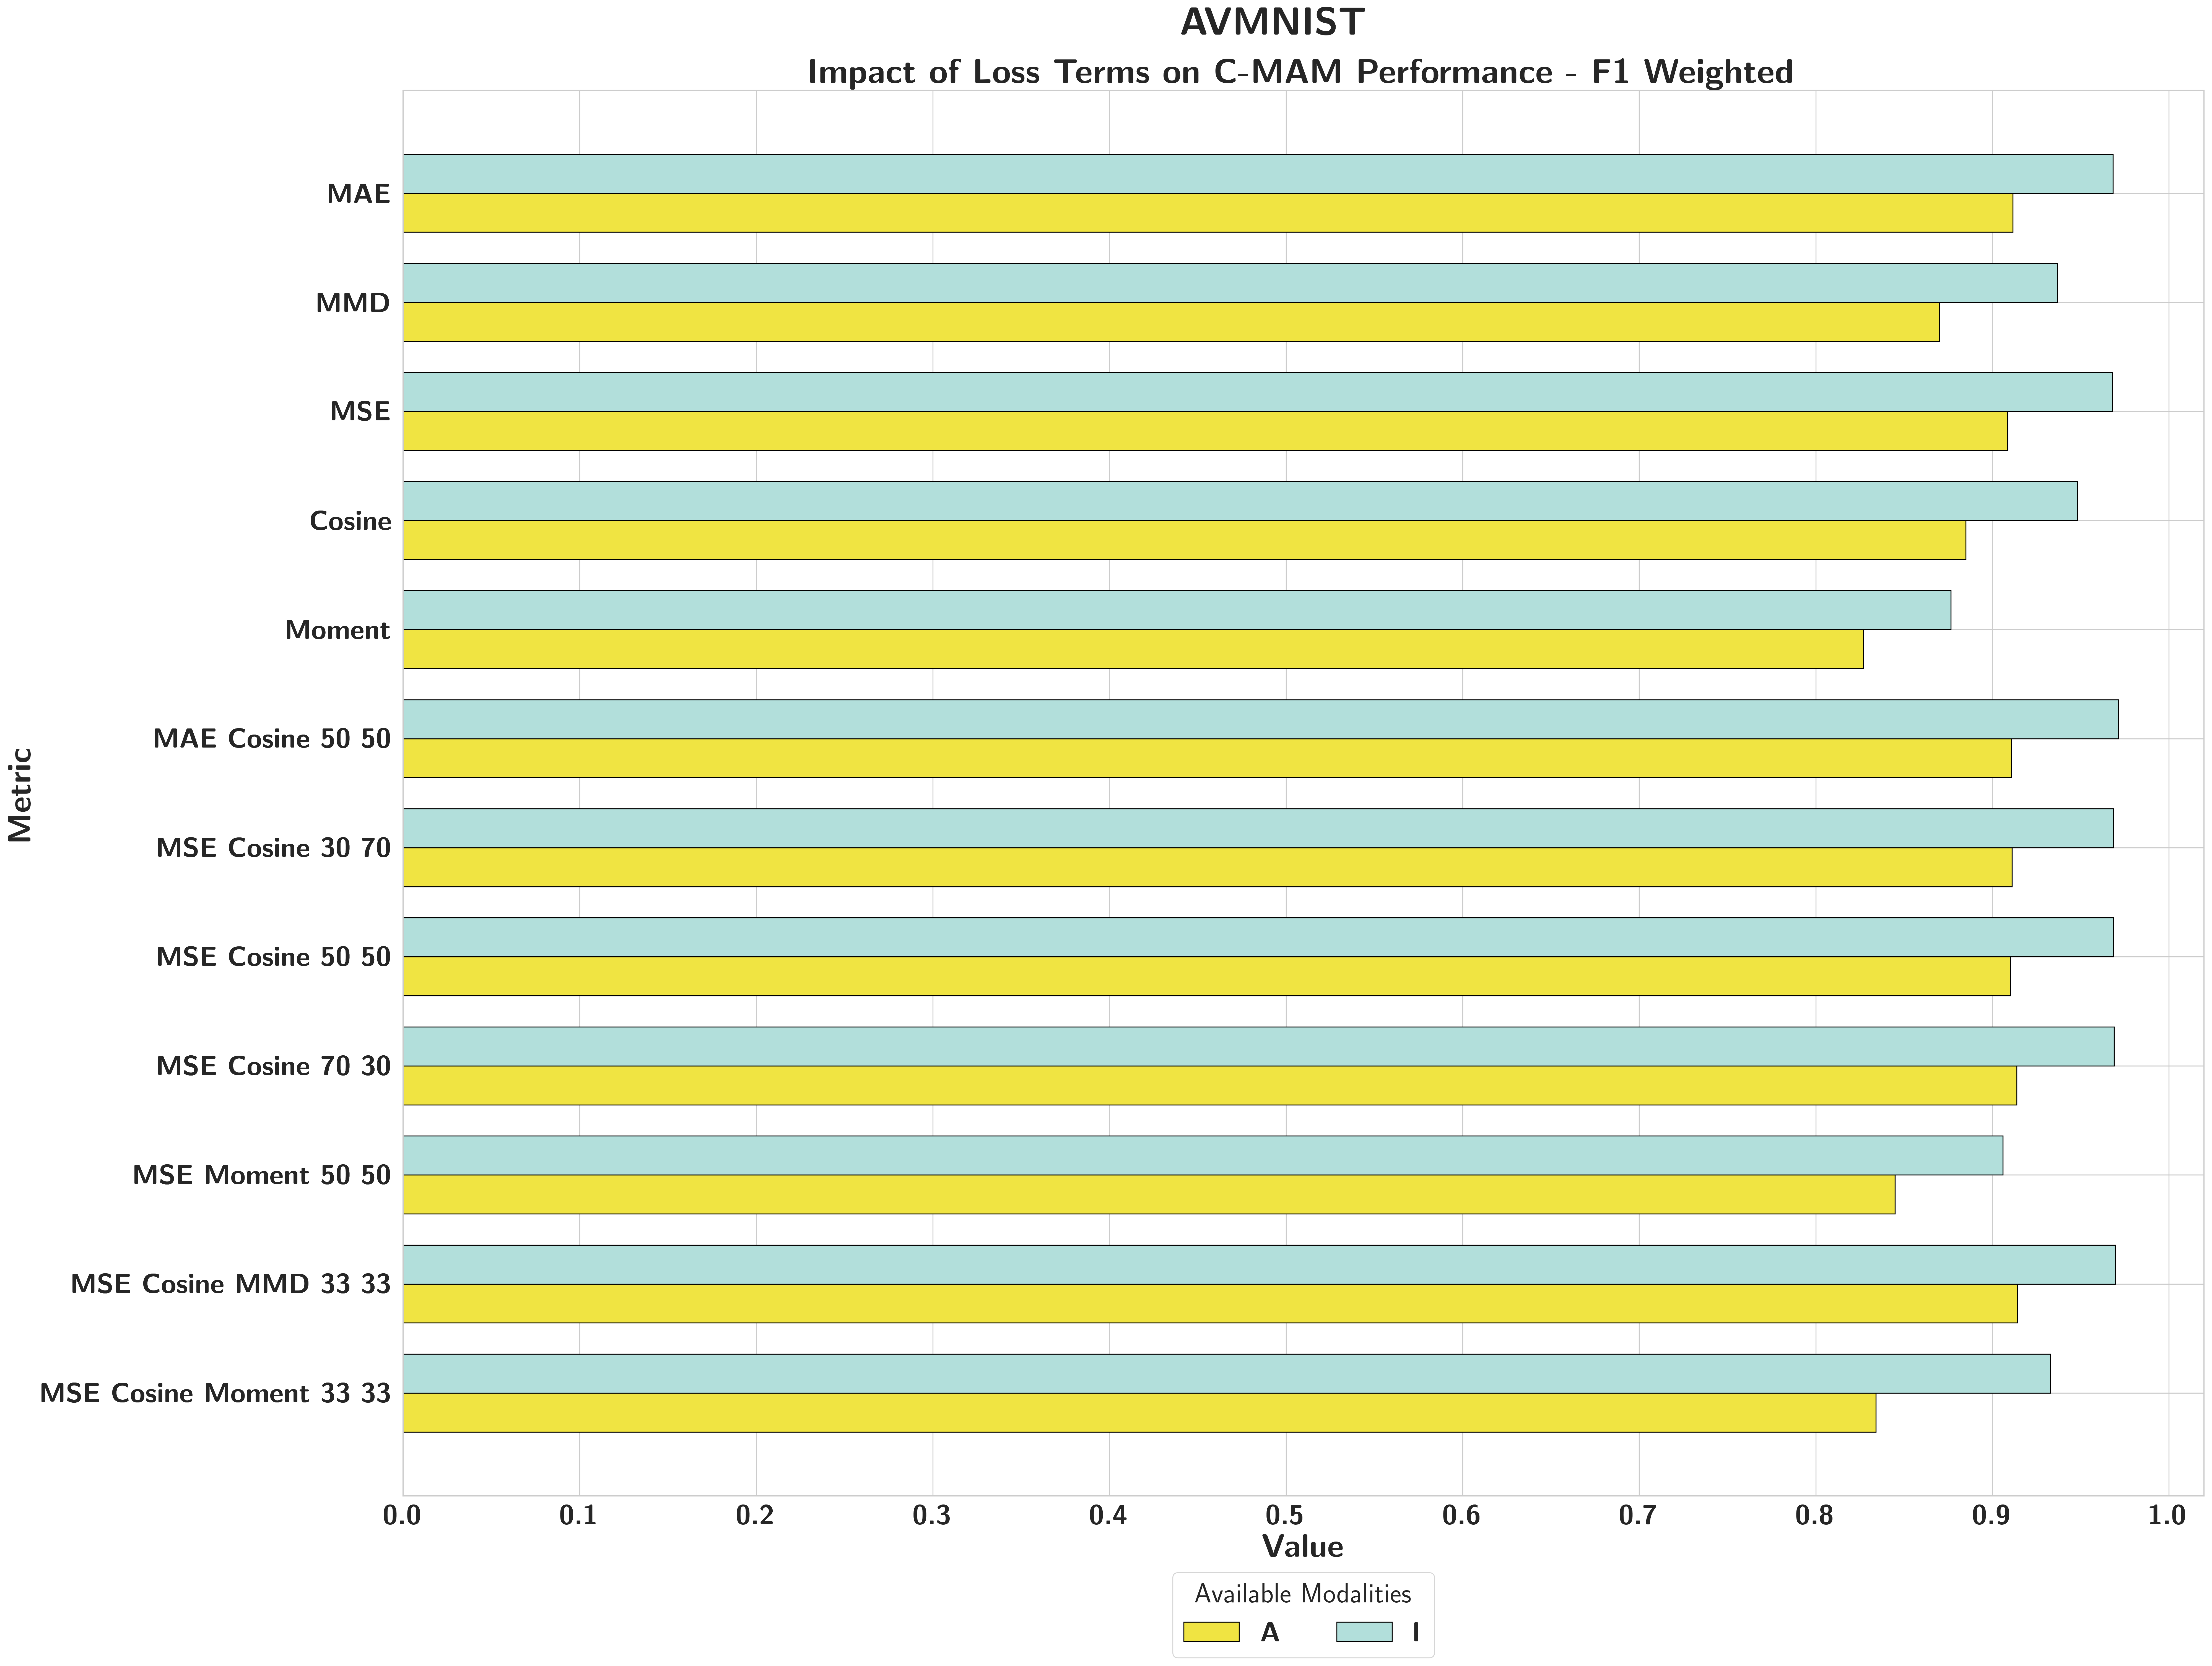
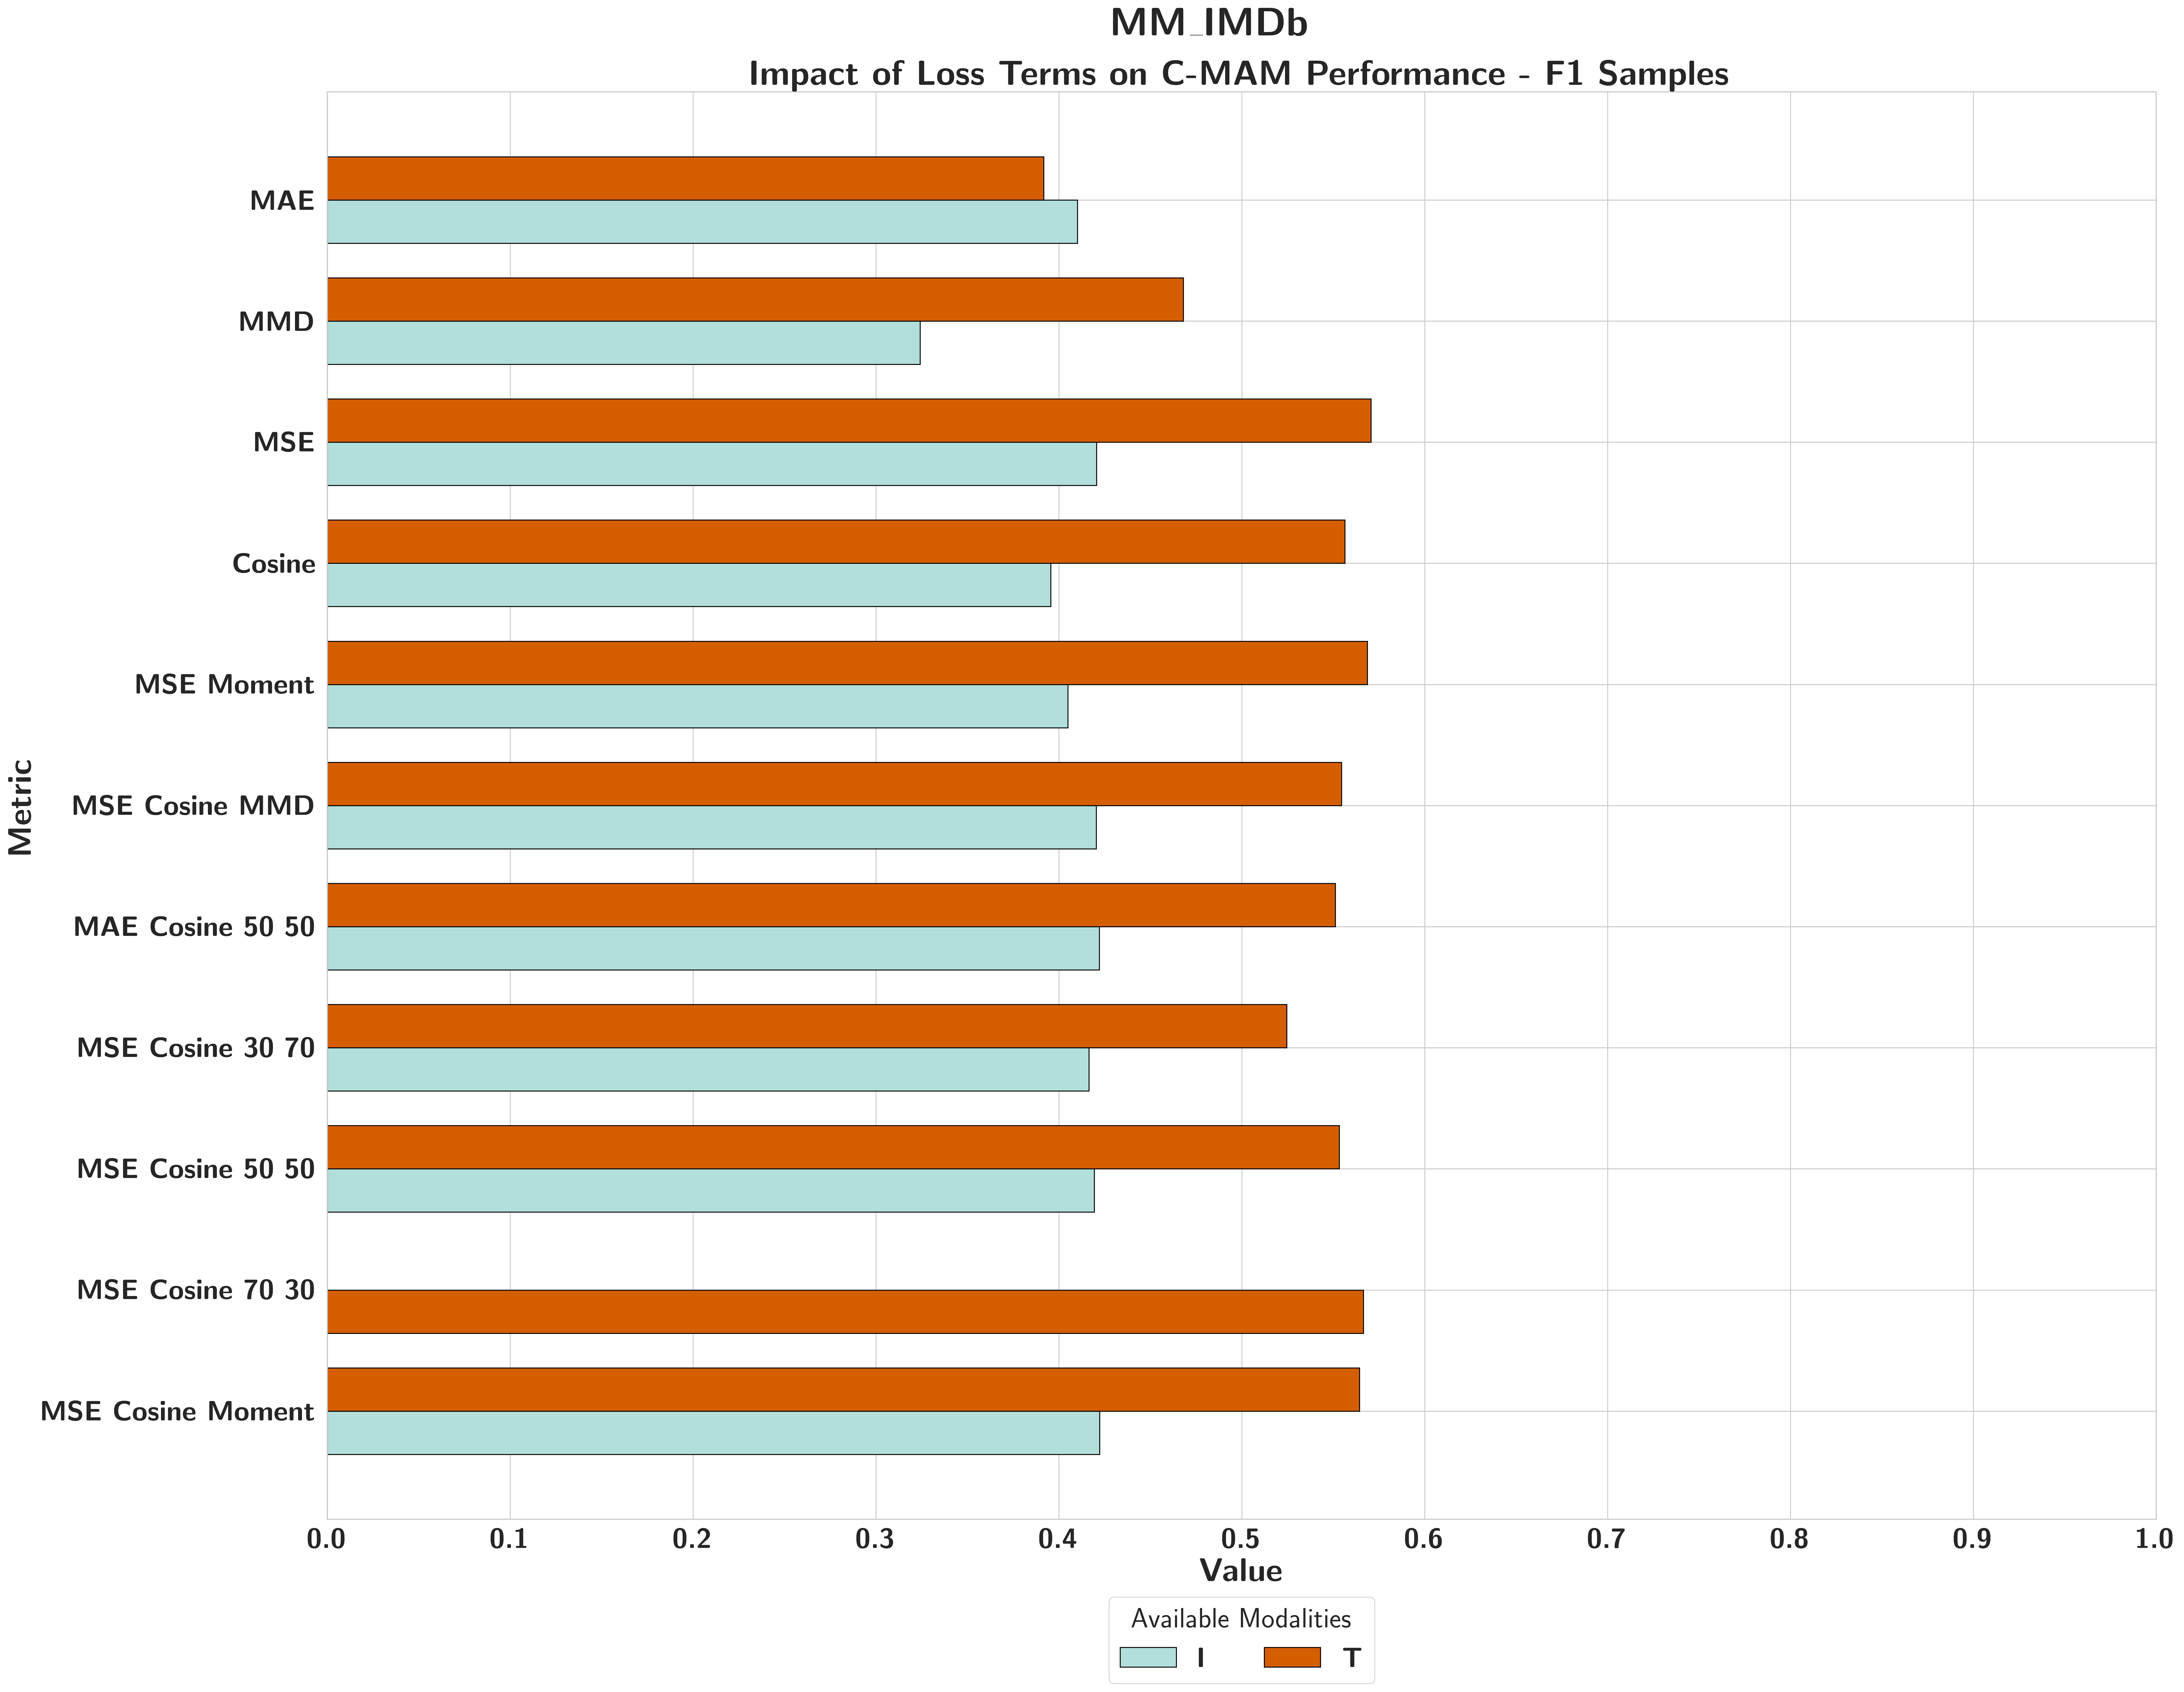
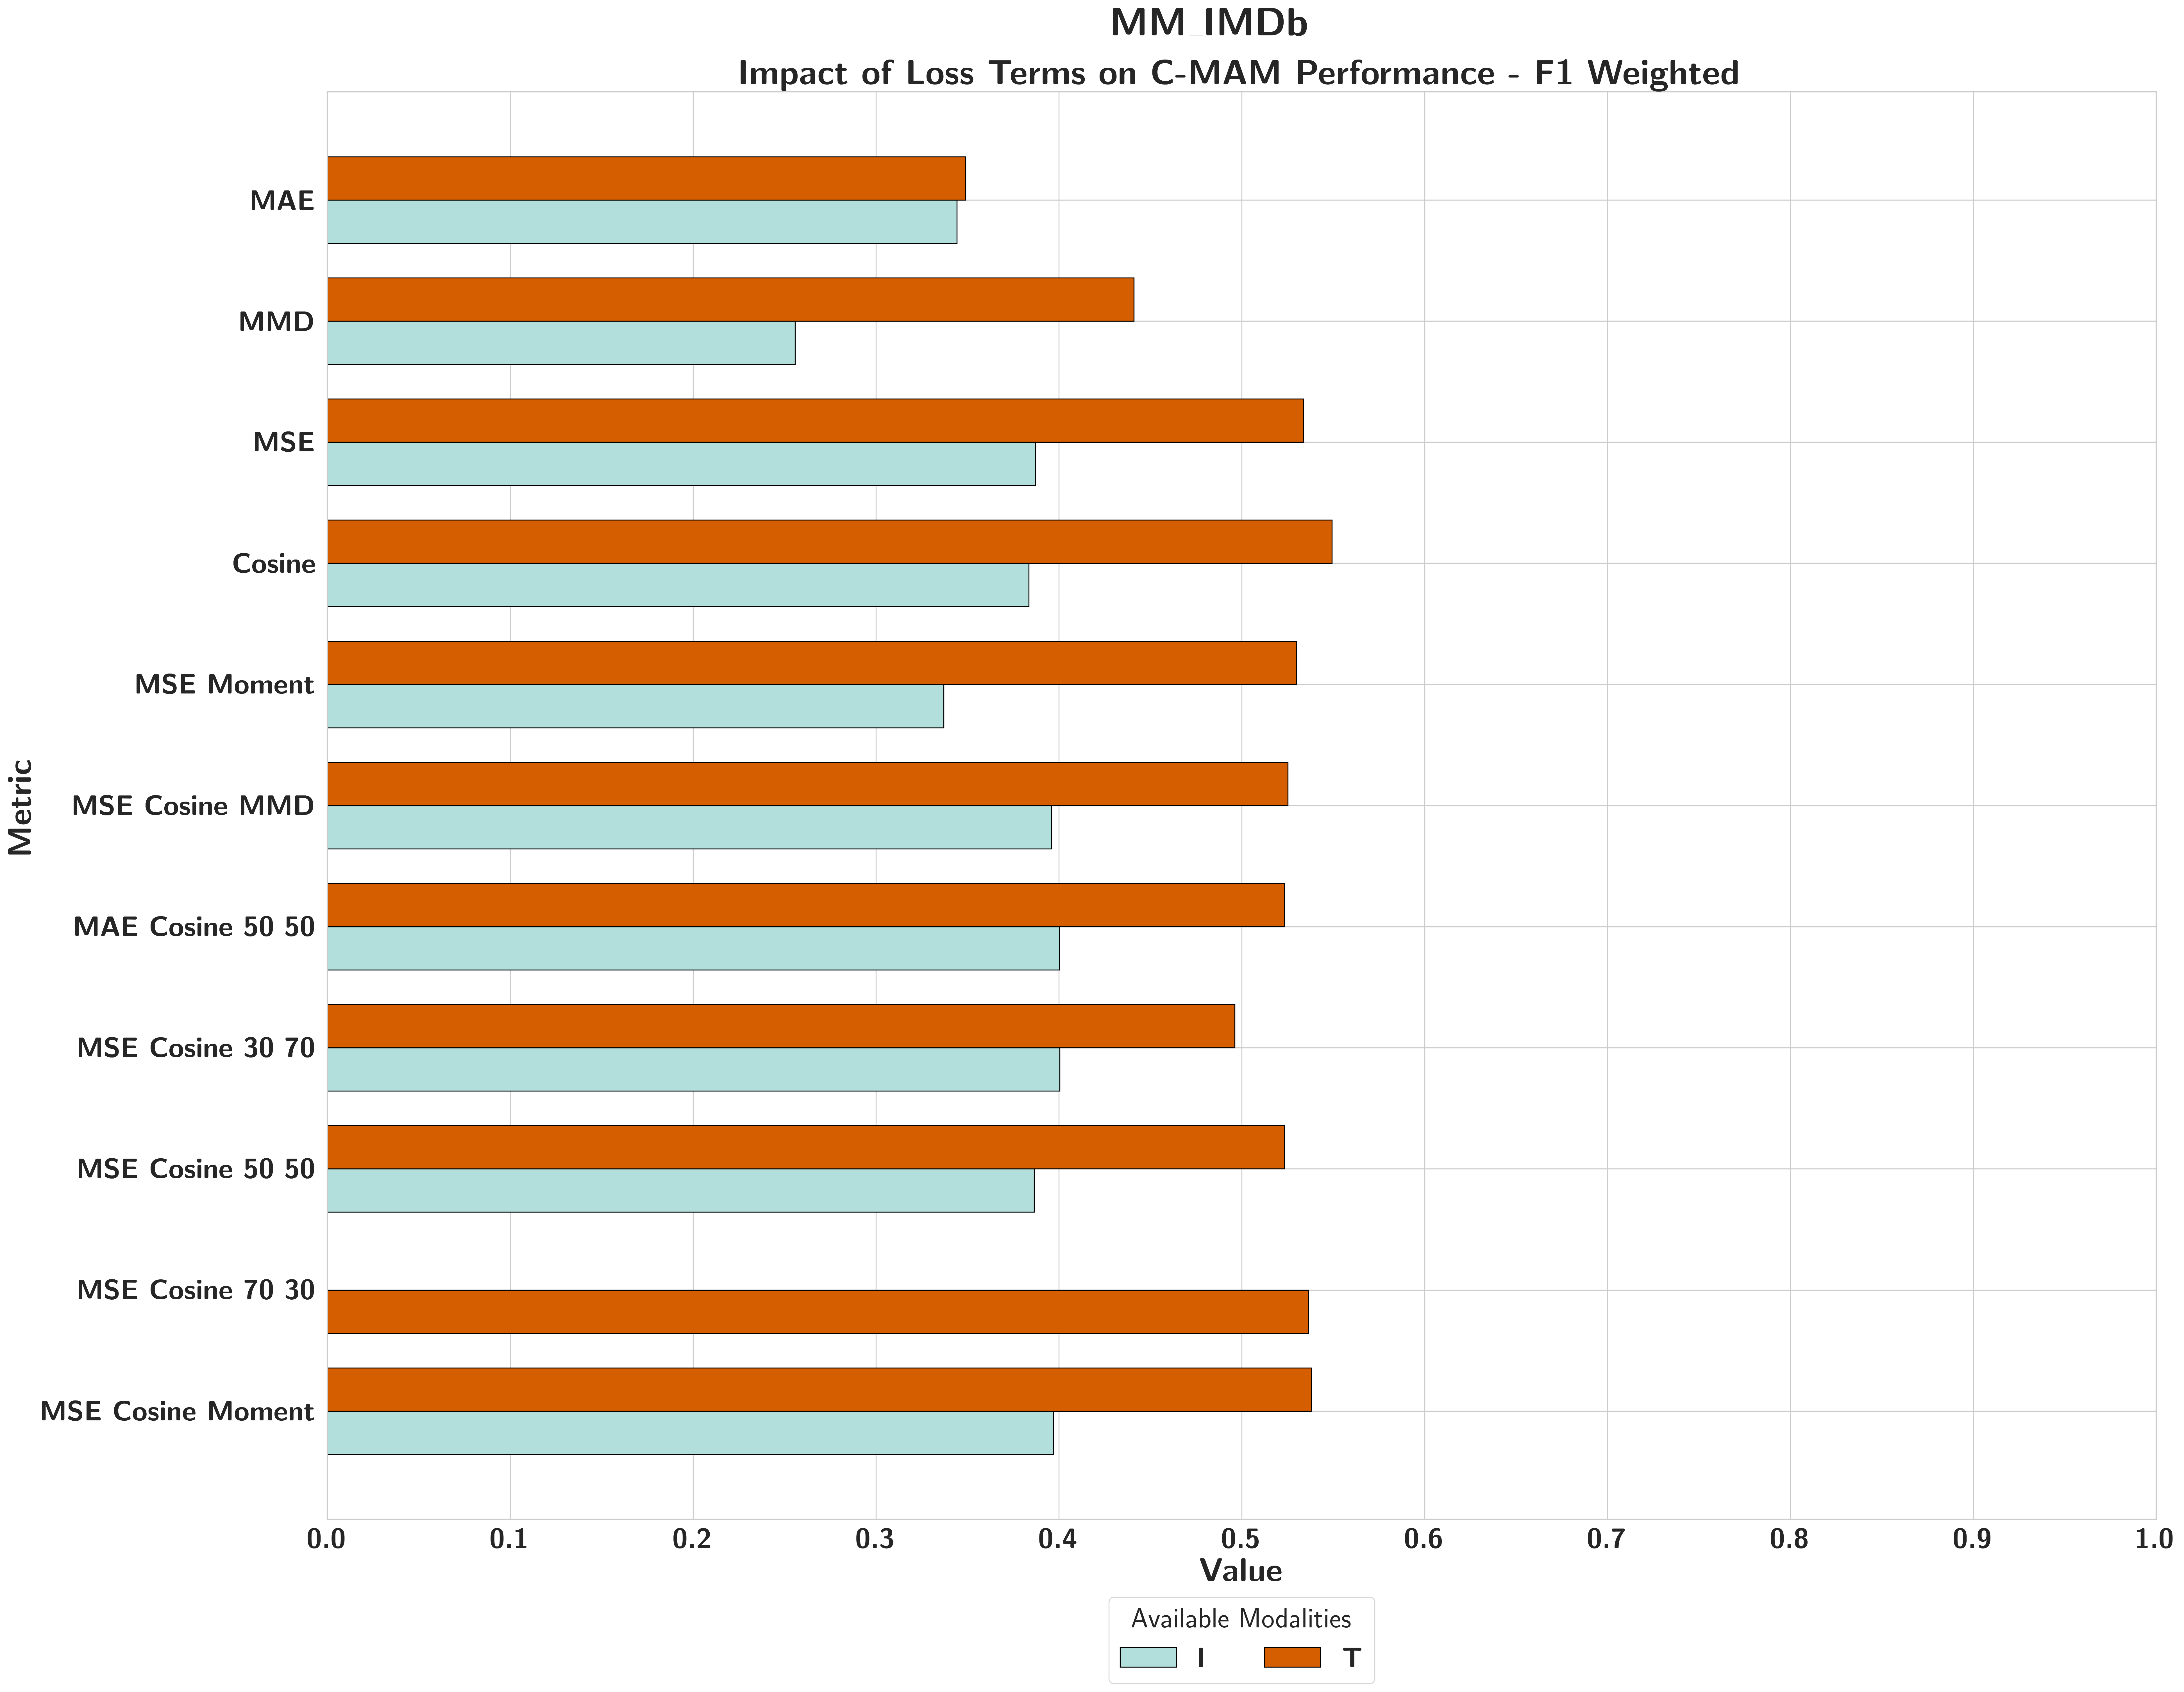
RQ2.2 — Loss function complexity
Loss function complexity has marginal influence: all 12 objectives converge to similar recovery levels across datasets. The objective is not the bottleneck — the encoder representations are.
AVMNISTLoss Insensitive
Across twelve loss configurations, the narrow performance spread shows the classifier is largely insensitive to the specific reconstruction objective once basic representational alignment is achieved.
MM-IMDbGeometry Bottleneck
Pointwise and distributional losses (such as MMD) yield nearly identical predictive outcomes; reconstruction efficacy is bottlenecked by the base model's geometric structure, not the optimisation objective.
MOSEIDiminishing Returns
The choice of loss function has marginal influence on final classification behaviour; complex or moment-based losses offer no meaningful gains over simple MSE.
What this shows
Across twelve loss configurations, downstream performance is largely insensitive to the choice of loss function.
All reasonable formulations converge to similar levels, with only marginal gains from combining cosine similarity and MSE in certain tasks.
Why it matters
The base model's latent space geometry is the dominant constraint on reconstruction quality, not the optimisation objective.
Simple losses like MSE are sufficient; complexity in the loss function yields diminishing returns.
RQ2.3
RQ2 — Post Hoc Modular ReconstructionRQ2.3 Results
RQ2.3 — Encoder fine-tuning
Frozen encoders are the correct default: training from scratch degrades key conditions, fine-tuning is inconsistent, and only frozen encoders guarantee a stable representation space for C-MAMs to operate within.
MOSEIFrozen = Best
Frozen encoders reused from the base model provide the best balance of performance and efficiency. Retraining from scratch frequently degrades accuracy by disrupting the established alignment with the classification head.
MOSEI: per-condition performance (Has0 Accuracy / Has0 F1 Weighted)
Cond.
Random Init Δ
Fine-tuned Δ
Has0 Acc
Has0 F1W
Has0 Acc
Has0 F1W
A
−0.0400
−0.0543
+0.0459
+0.0284
V
+0.0065
+0.0047
+0.0642
+0.0545
T
−0.0194
−0.0081
−0.0012
+0.0020
AV
−0.0015
−0.0018
−0.0089
−0.0027
AT
−0.0044
−0.0034
−0.0017
−0.0024
VT
+0.0035
+0.0042
+0.0011
+0.0002
Δ = difference vs. frozen encoder baseline. Has0 = missing-modality condition. Negative = worse than frozen.
Mean Δ across all conditions (Has0 Accuracy & Has0 F1 Weighted)
Condition
Random Init
Fine-tuned
A
−0.0270
+0.0400
V
+0.0106
+0.0451
T
−0.0142
−0.0019
AV
+0.0105
+0.0059
AT
−0.0067
−0.0050
VT
+0.0046
+0.0017
Mean Δ across Has0 Accuracy and Has0 F1 Weighted. Negative = worse than frozen baseline.
What this shows
Frozen encoders match or outperform fine-tuned alternatives at significantly lower cost.
Retraining from scratch actively degrades performance by disrupting alignment with the base model's classification head.
Why it matters
C-MAMs do not require encoder retraining to function. Task-relevant structure is already present, it only needs to be re-associated.
This preserves the lightweight, post-hoc modularity that makes the framework practical.
RQ2.4
RQ2 — Post Hoc Modular ReconstructionRQ2.4 Results
RQ2.4 — Reconstruction quality vs performance recovery
Reconstruction geometry and performance recovery are decoupled: what determines recovery is inter-modal representational alignment, not geometric precision in embedding space.
AVMNISTNear-Baseline
Cosine 0.883. Most dimensions not significantly different. Recovery matches baseline without geometric precision.
MM-IMDbSemantic Alignment
Cosine 0.051, near-orthogonal, yet CRR reaches 1.08. Looks nothing like the original; the classifier cannot tell the difference.
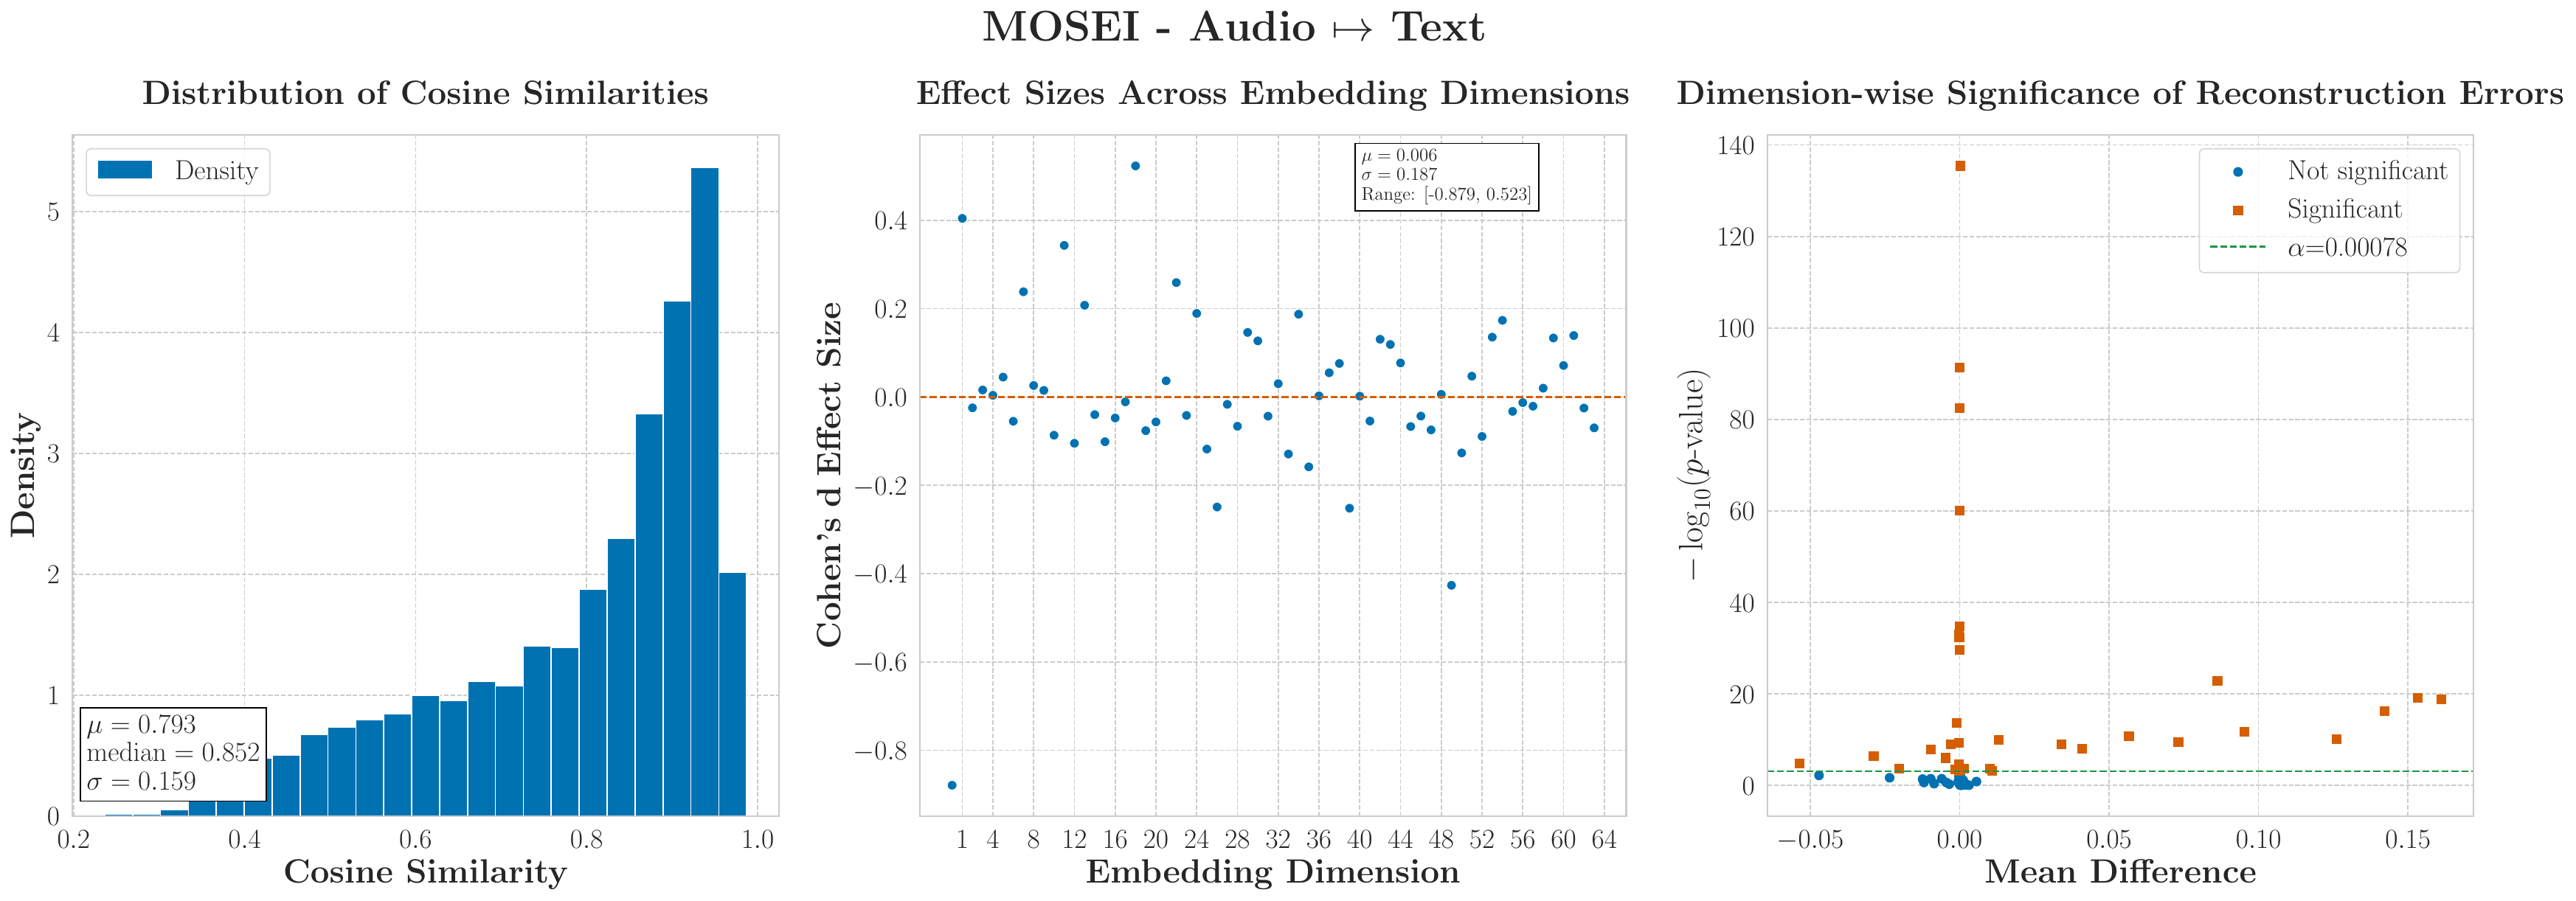
MOSEIUtility vs Fidelity
Cosine 0.79, many significant dimensions, but Cohen's d near 0. Statistical significance is not practical significance.
Kinetics-SoundsAlignment Barrier
MSE 32.79, CRR only 6%. Cosine approx. -0.04. The ceiling is set by encoder alignment, not decoder quality.
Reconstruction Error — MAE / MSE
Model & C-MAM
MAE
MSE
KS — Audio → Video
3.82
32.79
KS — Video → Audio
0.69
1.32
MM-IMDb — Image → Text
0.30
0.16
MM-IMDb — Text → Image
0.29
0.14
UTT-Fusion — AT → Video
0.07
0.009
UTT-Fusion — Audio → Video
0.22
0.11
UTT-Fusion — Audio → Text
0.23
0.19
UTT-Fusion — VT → Audio
0.10
0.02
KS audio→video is the study maximum (MSE=32.79). High reconstruction error correlates with near-orthogonal encoder spaces, not decoder failure.
What this shows
Geometric fidelity and functional utility are decoupled.
Cosine similarity 0.051 (near-orthogonal) still yields near-baseline or above-baseline accuracy in MM-IMDb. High reconstruction error does not prevent meaningful performance gains where encoder spaces are compatible.
Why it matters
The goal of reconstruction is functional sufficiency, not geometric replication.
Evaluation criteria based on embedding similarity alone are the wrong measure of whether a reconstruction module is working.
RQ2.5
RQ2 — Post Hoc Modular ReconstructionRQ2.5 Results
RQ2.5 — Modality interactions and reconstruction ceiling
The reconstruction ceiling is set by how well the encoder spaces align — contrastive or orthogonal encoder representations impose a hard limit that no decoder design, loss function, or additional data can overcome.
AVMNISTTask Redundancy
High task redundancy and dataset co-occurrence allow significant performance recovery even though base model embeddings are geometrically contrastive — task redundancy compensates for geometric misalignment.
Kinetics-SoundsAlignment Bottleneck
Extreme contrastiveness and near-orthogonality of audio and video embeddings define a structural boundary making post-hoc reconstruction inherently difficult — a hard limit no C-MAM design can overcome.
MOSEIBounded Recovery
Moderate cross-modal alignment facilitates robust reconstruction, yet the C-MAM's corrective capacity is strictly bounded by the semantic correspondences established during the base model's initial training.
Contrastive information analysis — representational alignment across datasets predicts recovery ceiling
Dataset
MI Reduction adding 2nd modality
Modality
Dominance
PMI co-occurrence
Cosine
Similarity
Sym. KL
Divergence
C-MAM
Recovery
MOSEI
Moderate
Text
Low (0.096)
Moderate
0.28–0.38
0.338
Moderate–High
(text-bounded)
Kinetics-Sounds
Strong ↓ MI
Video
Very low (0.006)
Near-orthogonal
−0.040
2.954
Low–Moderate
(encoder bottleneck)
AVMNIST
Weak
Image
High (6.894)
Near-orthogonal
0.006
0.852
High
(task redundancy)
Kinetics-Sounds: high KL + near-orthogonal cosine = encoders learned competing decision boundaries. AVMNIST: near-orthogonal cosine BUT high PMI — task redundancy compensates for geometric misalignment.
What this shows
Reconstruction capability is bounded by inter-modal alignment.
Semantically aligned modalities recover well; contrastive or orthogonal modalities, such as Kinetics-Sounds, are significantly harder to reconstruct.
Why it matters
Reconstructability is an intrinsic property of how the base model encoded its modalities, not of the reconstructor itself.
This makes catastrophic sensor failures predictable in advance, before they occur.
RQ2 synthesis
RQ2 — Post Hoc Modular ReconstructionSynthesis
RQ2 synthesis
To what extent can a modular, lightweight, and post-training feature reconstruction approach mitigate performance degradation caused by fully missing modalities during multimodal model inference?
Resolved Sub-Questions
RQ2.1
How does varying training data availability affect C-MAMs' reconstruction and inference performance?
C-MAMs achieve substantial recovery even with limited data; gains plateau early when inter-modality structure is strong.
RQ2.2
How does loss function complexity influence reconstruction quality and inference performance?
Simple MSE-based objectives are competitive; more complex losses do not consistently improve downstream performance.
RQ2.3
How does fine-tuning pre-trained encoders during C-MAM training affect reconstruction?
Fine-tuning does not reliably improve reconstruction; frozen encoders achieve comparable recovery in most settings.
RQ2.4
What is the relationship between embedding reconstruction quality and performance recovery?
Performance recovery does not scale linearly with geometric reconstruction quality; high error can coexist with substantial inference improvement.
RQ2.5
How do inherent modality interactions affect C-MAMs' reconstruction capability?
Recovery correlates with inter-modality structure; contrastive or weakly aligned modalities constrain reconstruction ceiling.
Answer to RQ2Post-training feature reconstruction via C-MAMs can recover over 50–90%+ of performance lost to missing modalities, requiring minimal data and no architectural changes.
Efficacy is bounded by the base model's latent structure, succeeding when modalities are semantically aligned but struggling when they are contrastive or orthogonal.
Transition
Recovery is possible.
But is everything behaving correctly?
RQ3 — Behavioural Fidelity of Reconstruction
RQ3 — Behavioural Fidelity of ReconstructionRQ3
Research question
How do reconstructed modality embeddings affect the decision behaviour of multimodal models relative to missing-modality baselines, and how do different reconstruction methods compare in terms of information recovery, calibration behaviour, and class-conditional predictive structure?
— Under Review with TBD
Sub-questions
RQ3.1
To what extent do reconstructed modality embeddings recover the information that is theoretically recoverable from the available inputs?
RQ3.2
How does reconstruction model complexity affect the generalisability of recovered predictive behaviour under missing-modality inference?
RQ3.3
Do reconstructed embeddings induce class-specific behavioural biases, and how do these manifest across reconstruction methods in confidence and calibration?
Approach
Compare reconstructed and ground-truth embeddings using geometric similarity and information recovery metricsH1
Analyse generalisation across reconstruction methods and model capacity; evaluate predictive divergenceH2.1 · H2.2
Assess class-conditional confidence and calibration behaviour; quantify behavioural variance relative to full-modality baselinesH3 · H4 · H5
RQ3.1
RQ3 — Behavioural Fidelity of ReconstructionRQ3.1 Results
RQ3.1 — Information recoverability
Lightweight C-MAM decoders more frequently match conditional variance bounds, recovering the full predictable cross-modal signal, while higher-capacity models often fall short, confirming that reconstruction fidelity is constrained by encoder representations rather than decoder capacity.
CMU-MOSEIPartial Saturation
Only a widened C-MAM for the audio-to-text mapping satisfies the conditional variance bound, while MMIN and RedCore fail to reach saturation across all tested configurations.
MSP-IMPROVBimodal Saturation
C-MAM successfully recovers the information-theoretic limit in two bimodal mappings, whereas MMIN and RedCore's reconstruction errors remain significantly above the conditional variance threshold.
IEMOCAP5/6 Saturated
C-MAM demonstrates the strongest information recovery, saturating five out of six mappings, while MMIN and RedCore succeed in only two and one cases, respectively.
Mapping
Model
RMSE
√Var(Y|X)
Δ
H1
A→T ★
C-MAM
0.588
0.154
+0.434
No
MMIN
0.171
0.095
+0.076
No
RedCore
0.816
0.662
+0.154
No
V→T
C-MAM
0.262
0.155
+0.107
No
MMIN
0.144
0.052
+0.092
No
RedCore
0.884
0.722
+0.162
No
AT→V ★
C-MAM
0.213
0.161
+0.052
No
MMIN
0.419
0.167
+0.252
No
RedCore
0.813
0.638
+0.175
No
★ A→T: C-MAM worst RMSE (0.588) → best behavioural recall (0.762); AT→V: C-MAM nearest to bound (Δ = +0.052). MMIN/RedCore closer geometrically, far worse behaviourally. AV→T, T→V, VT→A omitted; all show No support.
Mapping
Model
RMSE
√Var(Y|X)
Δ
H1
A→V
C-MAM
0.126
0.071
+0.056
No
MMIN
0.419
0.167
+0.252
No
RedCore
0.765
0.700
+0.064
No
AT→V ★
C-MAM
0.115
0.071
+0.045
Yes
MMIN
0.144
0.052
+0.092
No
RedCore
0.813
0.638
+0.175
No
TV→A ★
C-MAM
0.173
0.128
+0.045
Yes
MMIN
0.209
0.121
+0.087
No
RedCore
0.840
0.674
+0.166
No
★ C-MAM satisfies H1 in 2/6 mappings (AT→V, TV→A; Δ = +0.045 each). MMIN and RedCore fail all six. Remaining mappings (V→A, AV→T, T→A) all show No support.
Mapping
Model
RMSE
√Var(Y|X)
Δ
H1
A→T
C-MAM
0.168
0.105
+0.062
No
MMIN
0.184
0.097
+0.087
No
RedCore
0.821
0.742
+0.079
No
V→A ★
C-MAM
0.139
0.116
+0.024
Yes
MMIN
0.201
0.122
+0.079
No
RedCore
0.824
0.782
+0.042
Yes
TV→A ★
C-MAM
0.137
0.116
+0.021
Yes
MMIN
0.158
0.117
+0.040
Yes
RedCore
0.887
0.753
+0.134
No
★ C-MAM supports H1 in 5/6 mappings (only A→T fails, Δ = +0.062). MMIN supports in 2 (T→V, TV→A). RedCore supports in 1 (V→A). Strongest H1 result across all three datasets.
What this shows
C-MAMs consistently reach the information-theoretic limit on reconstruction quality, the conditional variance bound, while higher-capacity models like MMIN and RedCore frequently do not.
Decoder complexity is not the constraint.
Why it matters
When a lightweight decoder saturates the recoverable signal, further architectural scaling is futile.
Poor reconstruction performance points to the encoder, not the decoder; the base model never learned representations that support recovery.
RQ3.2
RQ3 — Behavioural Fidelity of ReconstructionRQ3.2 Results
RQ3.2 — Reconstruction model complexity
Increased reconstruction complexity undermines rather than improves minority-class generalisation. Lightweight C-MAMs achieve at least 95% behavioural parity with MMIN in most settings (H2.1), while RedCore, the highest-capacity model, consistently underperforms MMIN on minority-class recall across all datasets (H2.2).
CMU-MOSEI
H2.1: 4/6H2.2: 3/6
C-MAM meets the 95% parity threshold in four of six mappings (H2.1). RedCore underperforms MMIN on neutral recall in three mappings, with near-zero recall in unimodal text conditions (H2.2).
MSP-IMPROV
H2.1: 5/6H2.2: 6/6
C-MAM meets the 95% behavioural parity threshold in five of six mappings (H2.1). RedCore underperforms MMIN on neutral recall in all six mappings (H2.2 fully supported).
IEMOCAP
H2.1: 1/6H2.2: 6/6
C-MAM meets the 95% parity threshold in only one mapping on this dataset (H2.1: 1/6). RedCore underperforms MMIN on neutral recall in all six mappings (H2.2 fully supported).
Mapping
C-MAM
Neutral Recall
MMIN
Neutral Recall
RedCore
Neutral Recall
C-MAM
Bal. F1
MMIN
Bal. F1
RedCore
Bal. F1
H2.1
H2.2
A→T
0.762
0.114
0.000
0.365
0.382
0.334
Yes
Yes
V→T
0.743
0.072
0.008
0.376
0.395
0.377
Yes
Yes
AT→V
0.378
0.382
0.450
0.615
0.622
0.601
No
No
T→V
0.434
0.327
0.446
0.619
0.616
0.600
Yes
No
AV→T
0.298
0.140
0.025
0.381
0.410
0.384
No
Yes
TV→A
0.233
0.321
0.397
0.586
0.617
0.596
Yes
No
H2.1: C-MAM ≥95% parity in 4/6 mappings. H2.2: RedCore recall < MMIN recall in 3/6 (A→T, V→T, AV→T); collapses to near-zero in unimodal text conditions.
Mapping
C-MAM
Neutral Recall
MMIN
Neutral Recall
RedCore
Neutral Recall
C-MAM
Bal. F1
MMIN
Bal. F1
RedCore
Bal. F1
H2.1
H2.2
A→V
0.477
0.330
0.091
0.411
0.419
0.363
Yes
Yes
AT→V
0.610
0.588
0.441
0.603
0.580
0.528
Yes
Yes
V→A
0.116
0.047
0.009
0.461
0.476
0.469
Yes
Yes
AV→T
0.429
0.408
0.242
0.583
0.558
0.518
Yes
Yes
T→A
0.422
0.432
0.378
0.525
0.527
0.498
Yes
Yes
TV→A
0.467
0.541
0.438
0.647
0.558
0.506
No
Yes
H2.1: C-MAM ≥95% parity in 5/6 mappings (TV→A only failure: recall 0.467 vs. MMIN 0.541). H2.2: RedCore underperforms MMIN on neutral recall in all 6/6 mappings.
Mapping
C-MAM
Neutral Recall
MMIN
Neutral Recall
RedCore
Neutral Recall
C-MAM
Bal. F1
MMIN
Bal. F1
RedCore
Bal. F1
H2.1
H2.2
A→V
0.270
0.457
0.419
0.448
0.550
0.534
No
Yes
AT→V
0.595
0.640
0.599
0.718
0.727
0.671
No
Yes
V→A
0.336
0.490
0.380
0.429
0.470
0.472
No
Yes
AV→T
0.452
0.489
0.427
0.629
0.640
0.625
No
Yes
T→A
0.597
0.645
0.599
0.561
0.640
0.640
No
Yes
TV→A
0.679
0.544
0.512
0.667
0.647
0.626
Yes
Yes
H2.1: C-MAM meets parity threshold in 1/6 mappings (TV→A only). H2.2: RedCore underperforms MMIN on neutral recall in all 6/6 mappings.
What this shows
H2.1 confirmed: C-MAMs match or exceed MMIN on minority-class recall and balanced F1 in most settings (4/6 MOSEI, 5/6 MSP-IMPROV, 1/6 IEMOCAP).
H2.2 confirmed: RedCore systematically underperforms MMIN on neutral recall, fully across MSP-IMPROV and IEMOCAP and partially on MOSEI.
Why it matters
Complexity introduces overfitting to training-time modality patterns, increasing brittleness under genuine modality absence.
For safety-critical systems, minimal and modular decoders offer more stable and predictable generalisation.
RQ3.3
RQ3 — Behavioural Fidelity of ReconstructionRQ3.3 Results
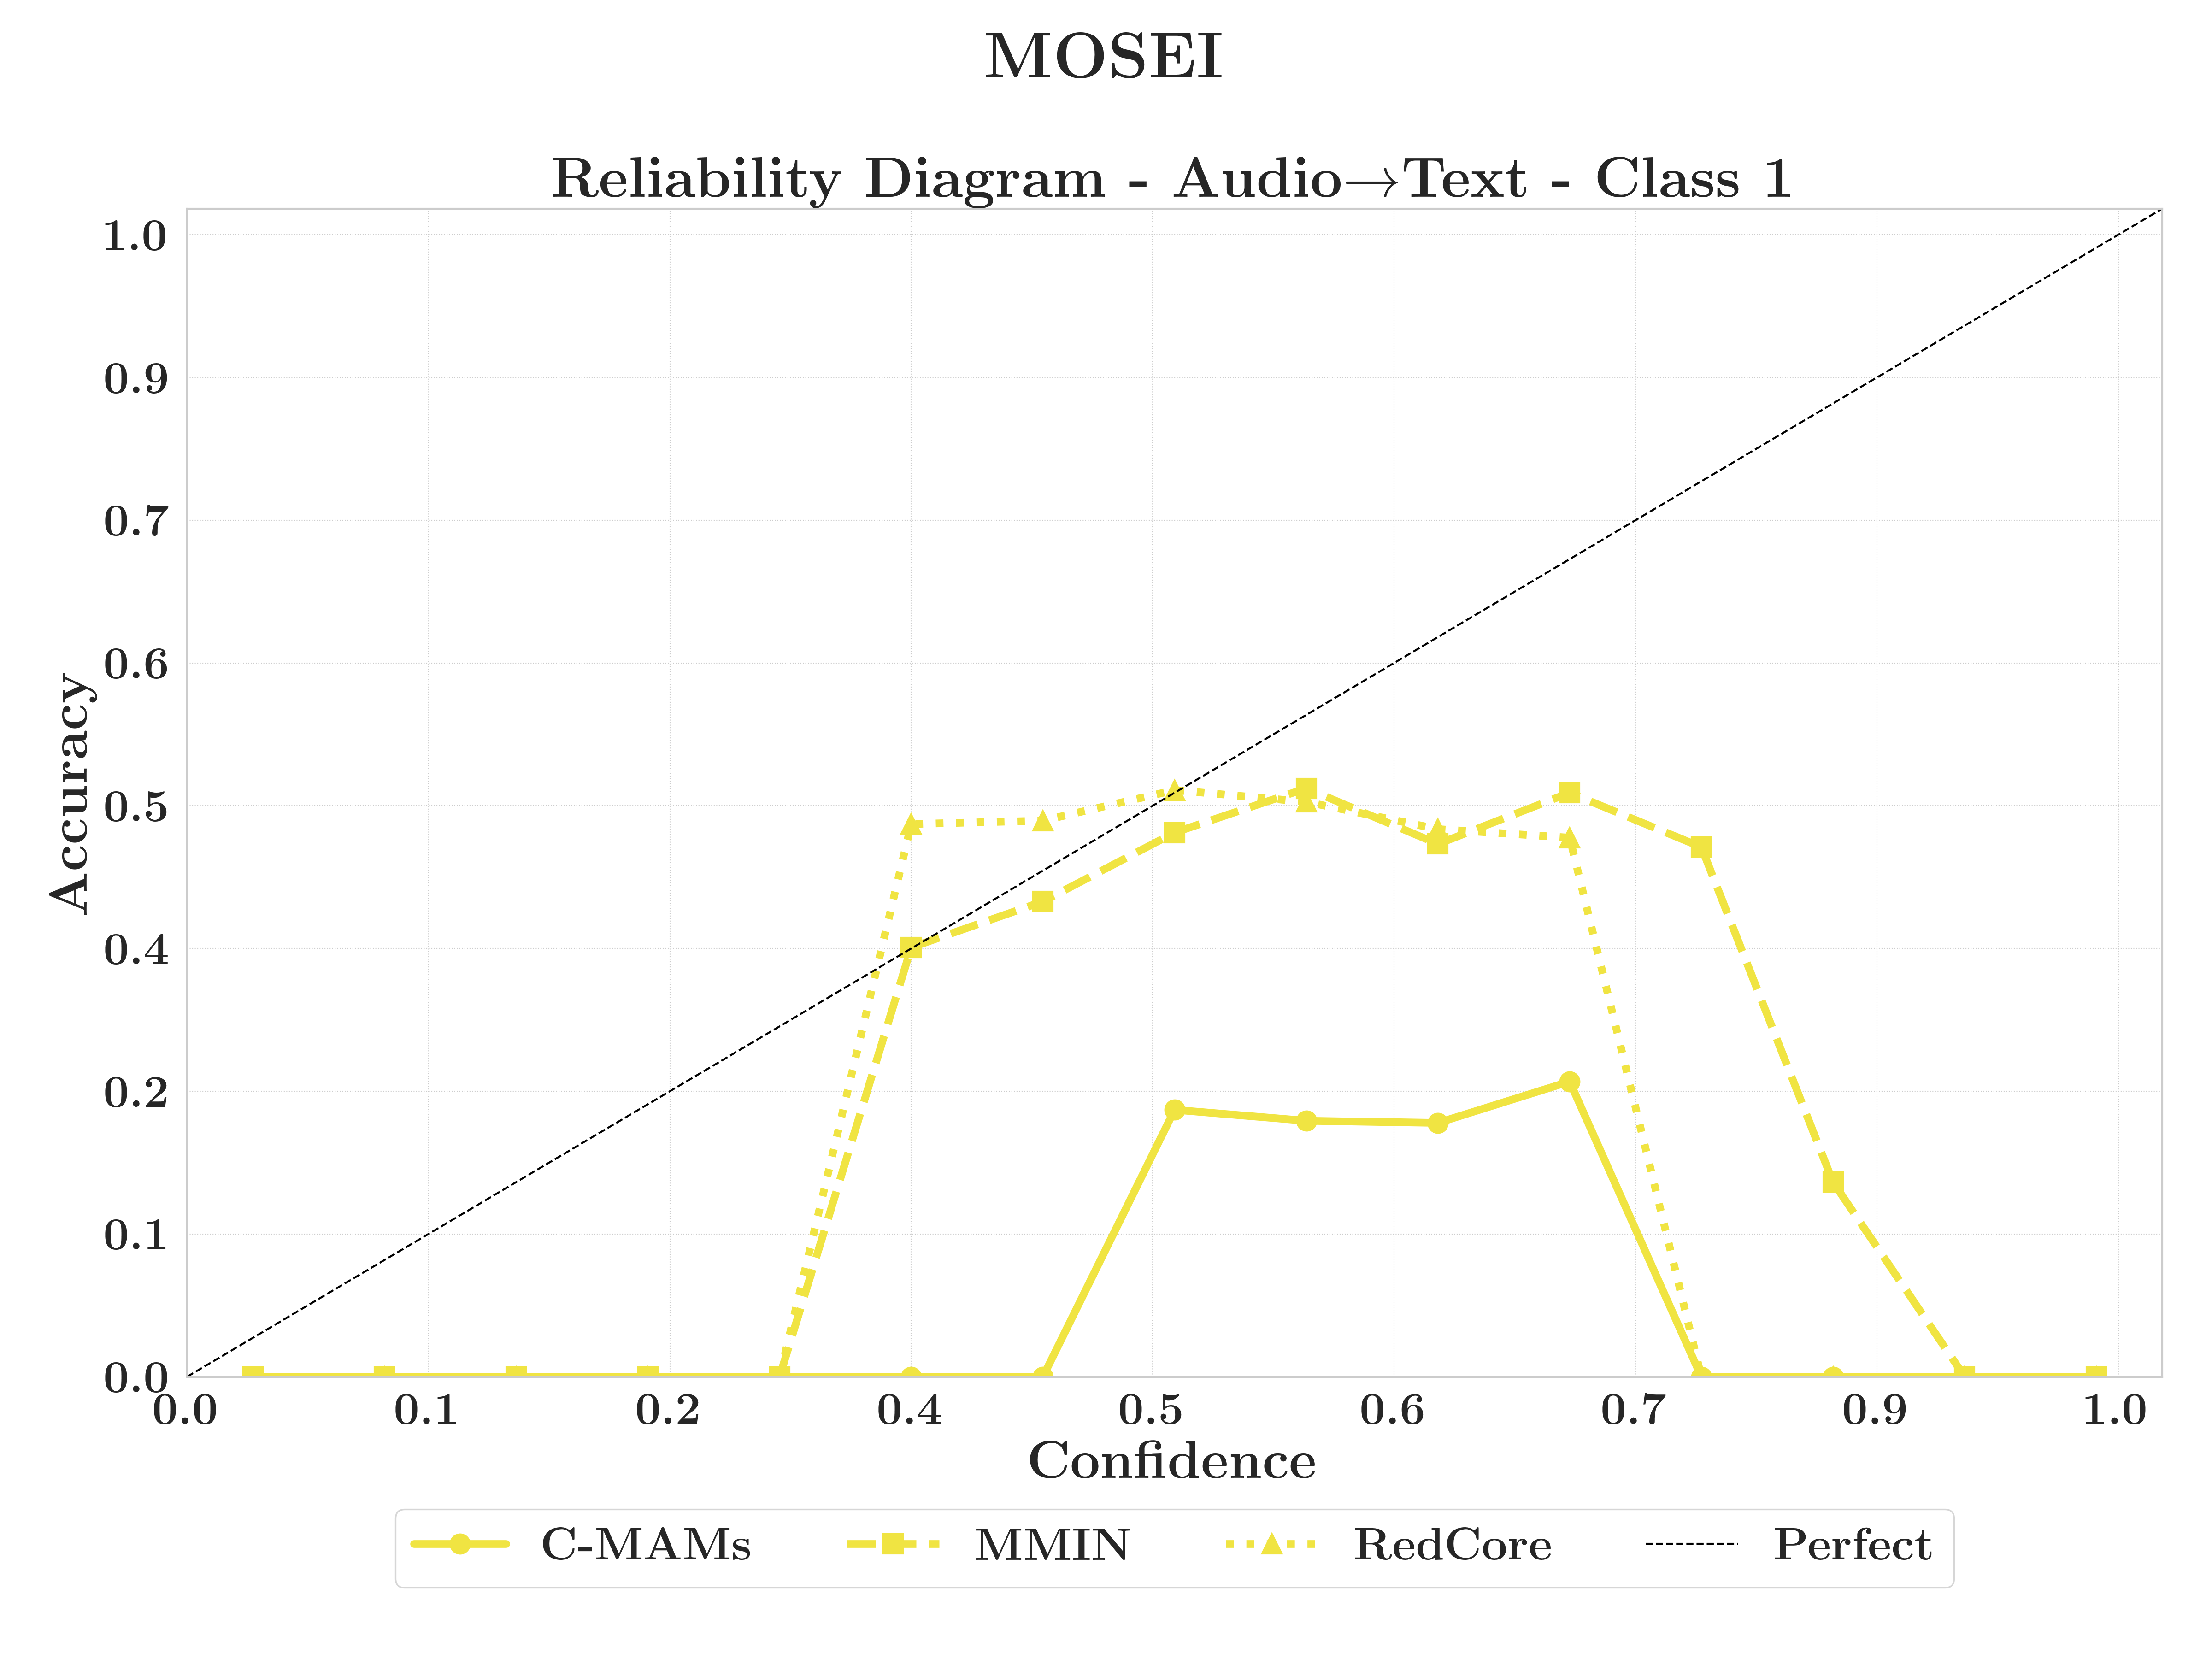
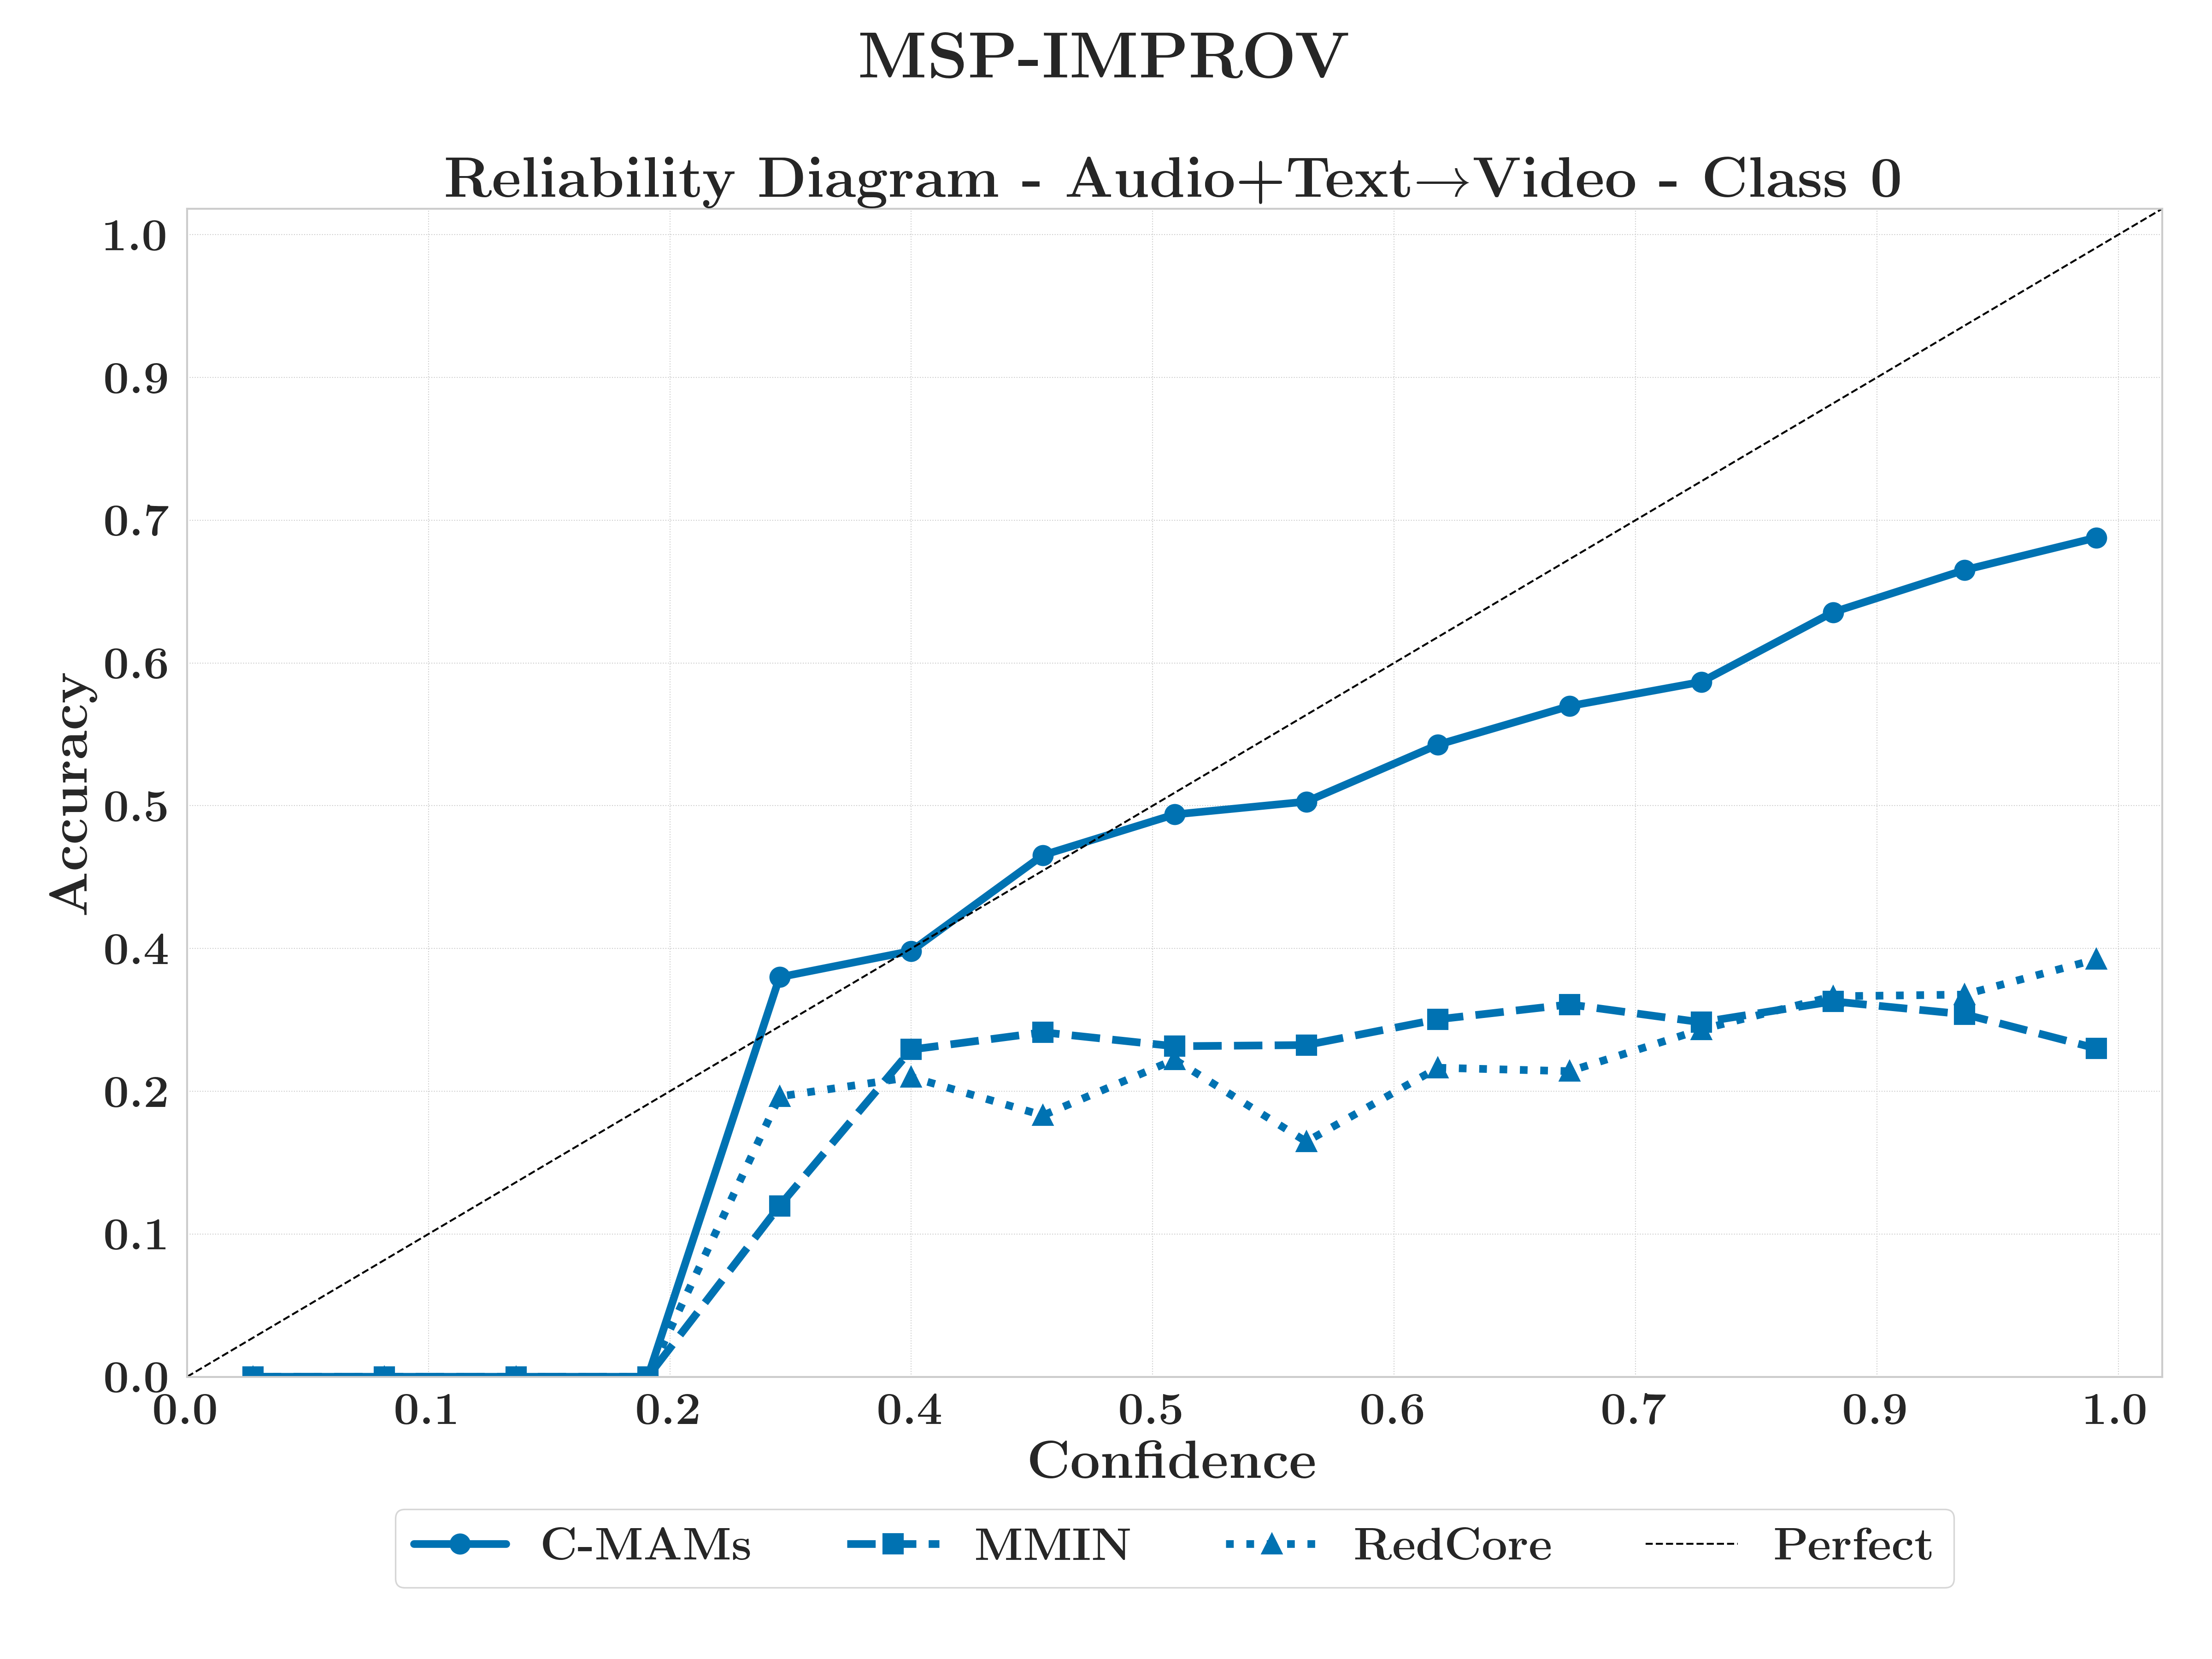
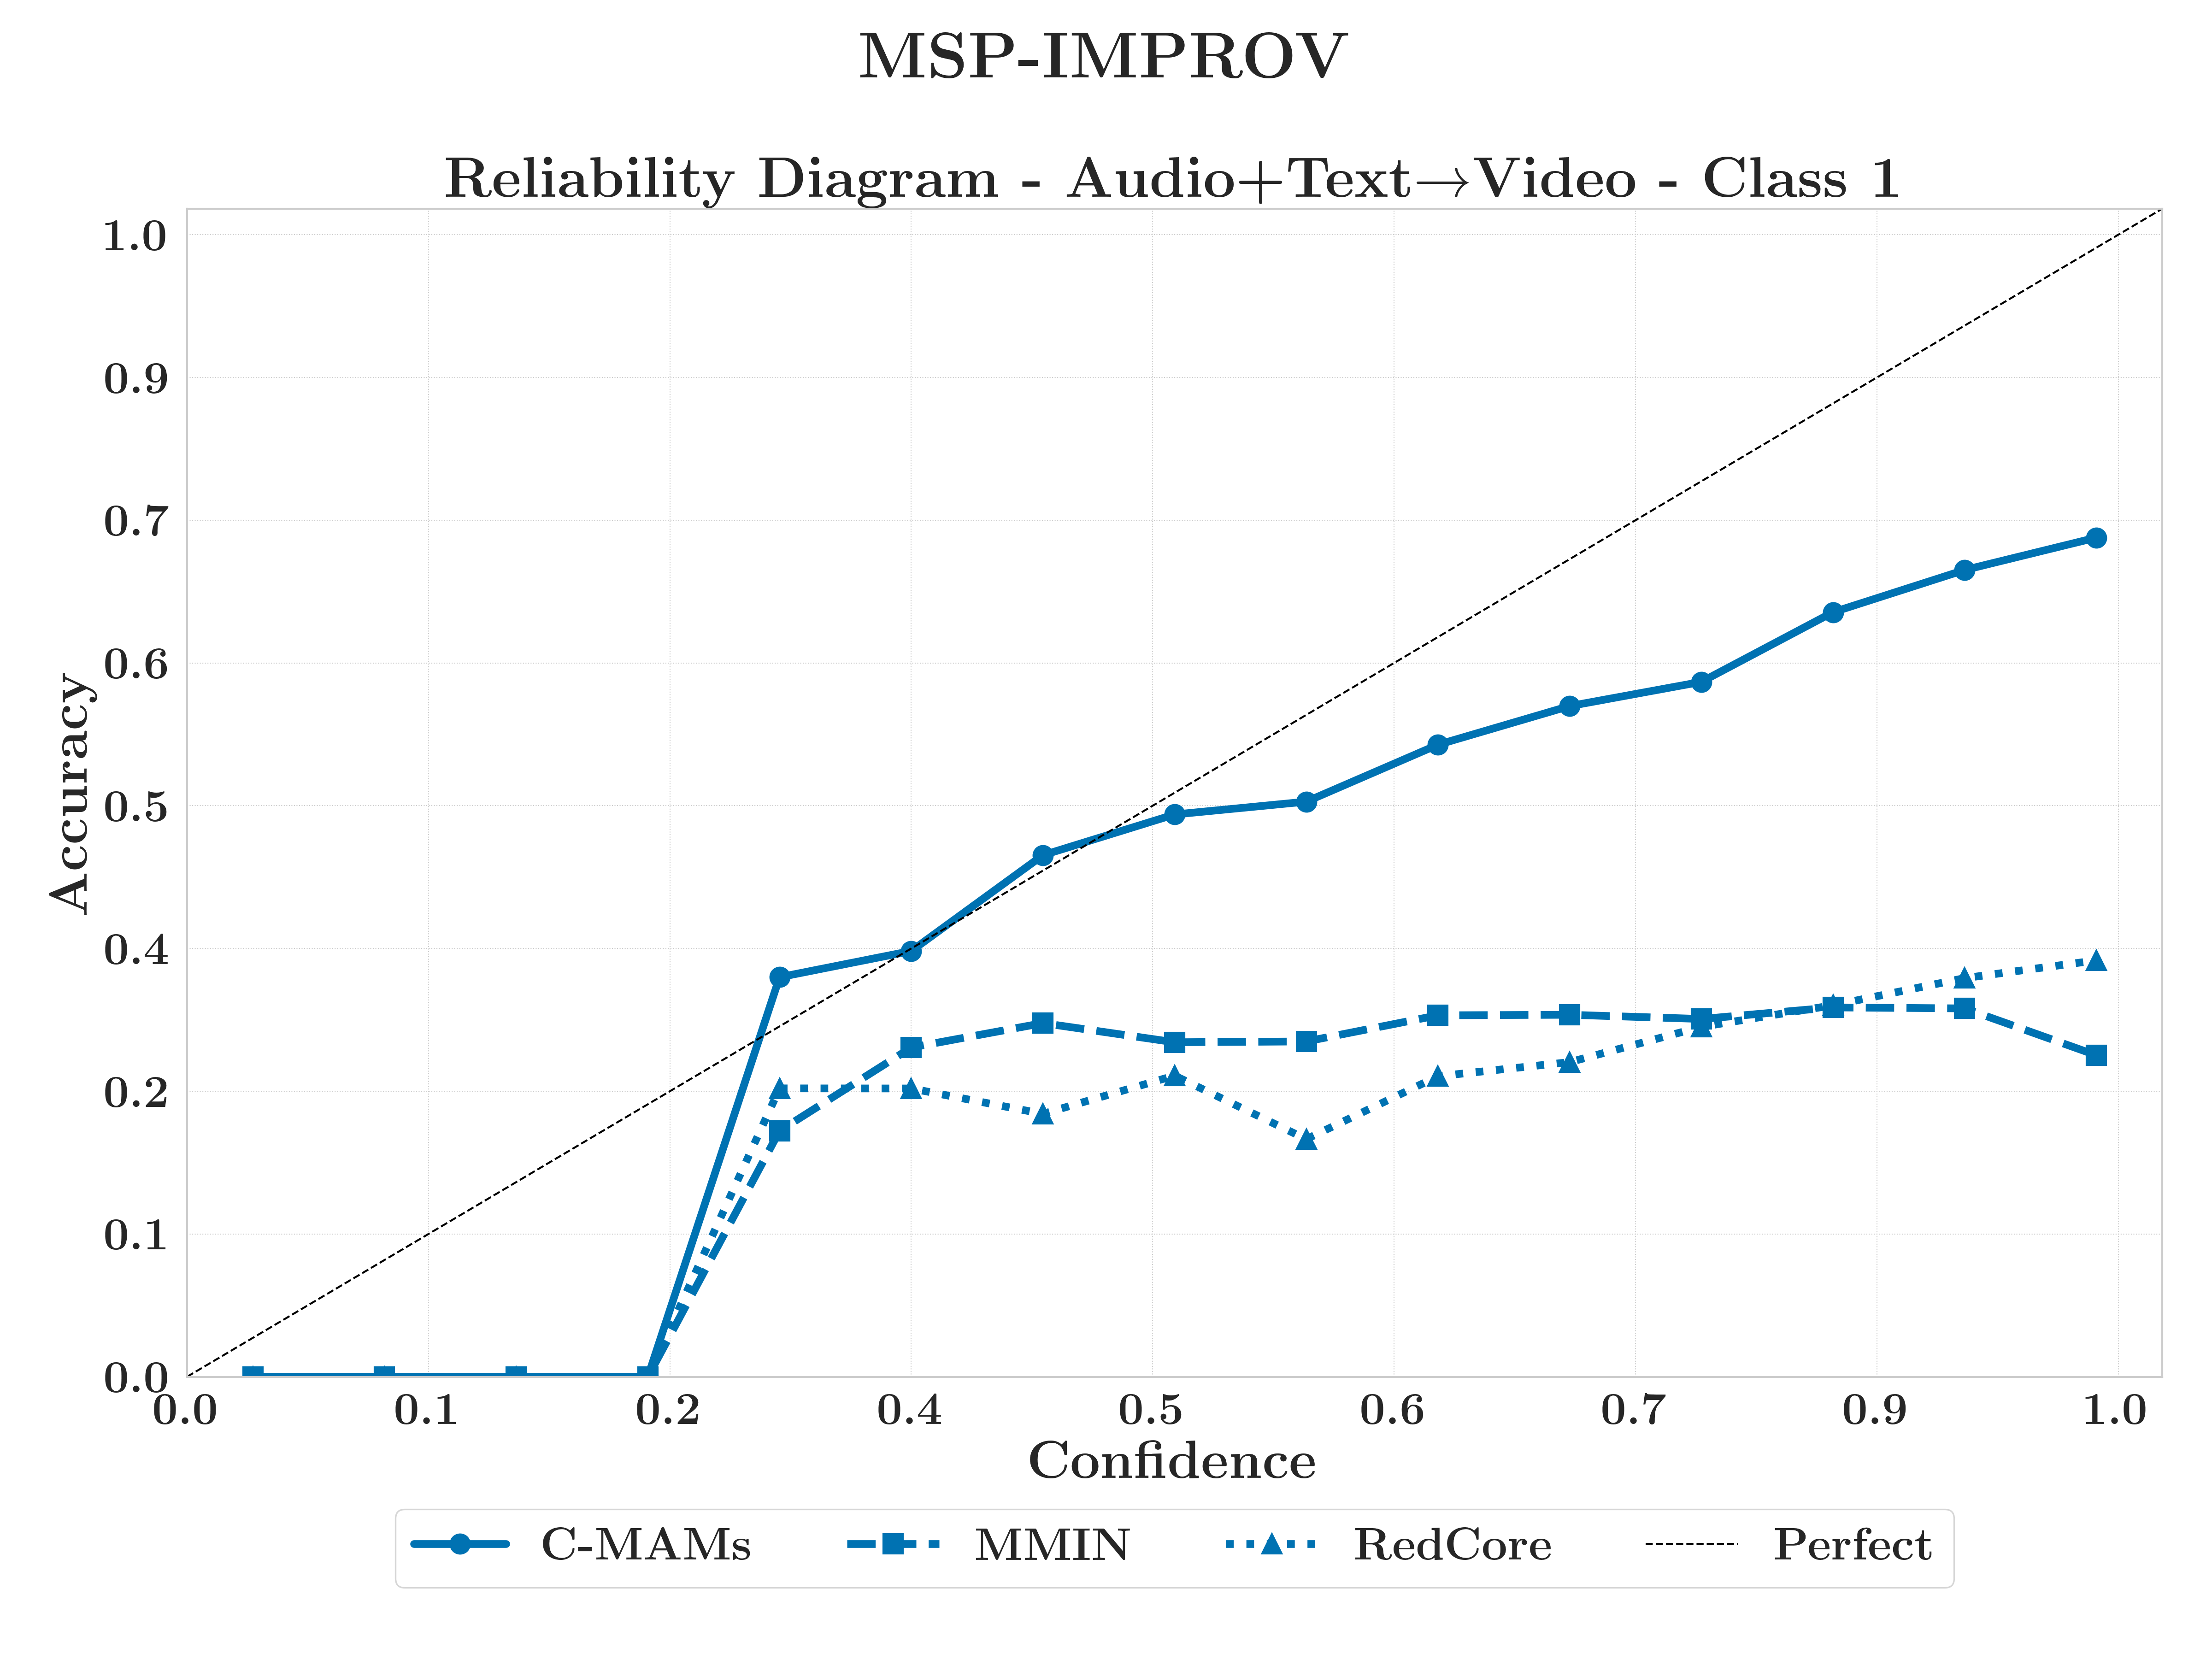
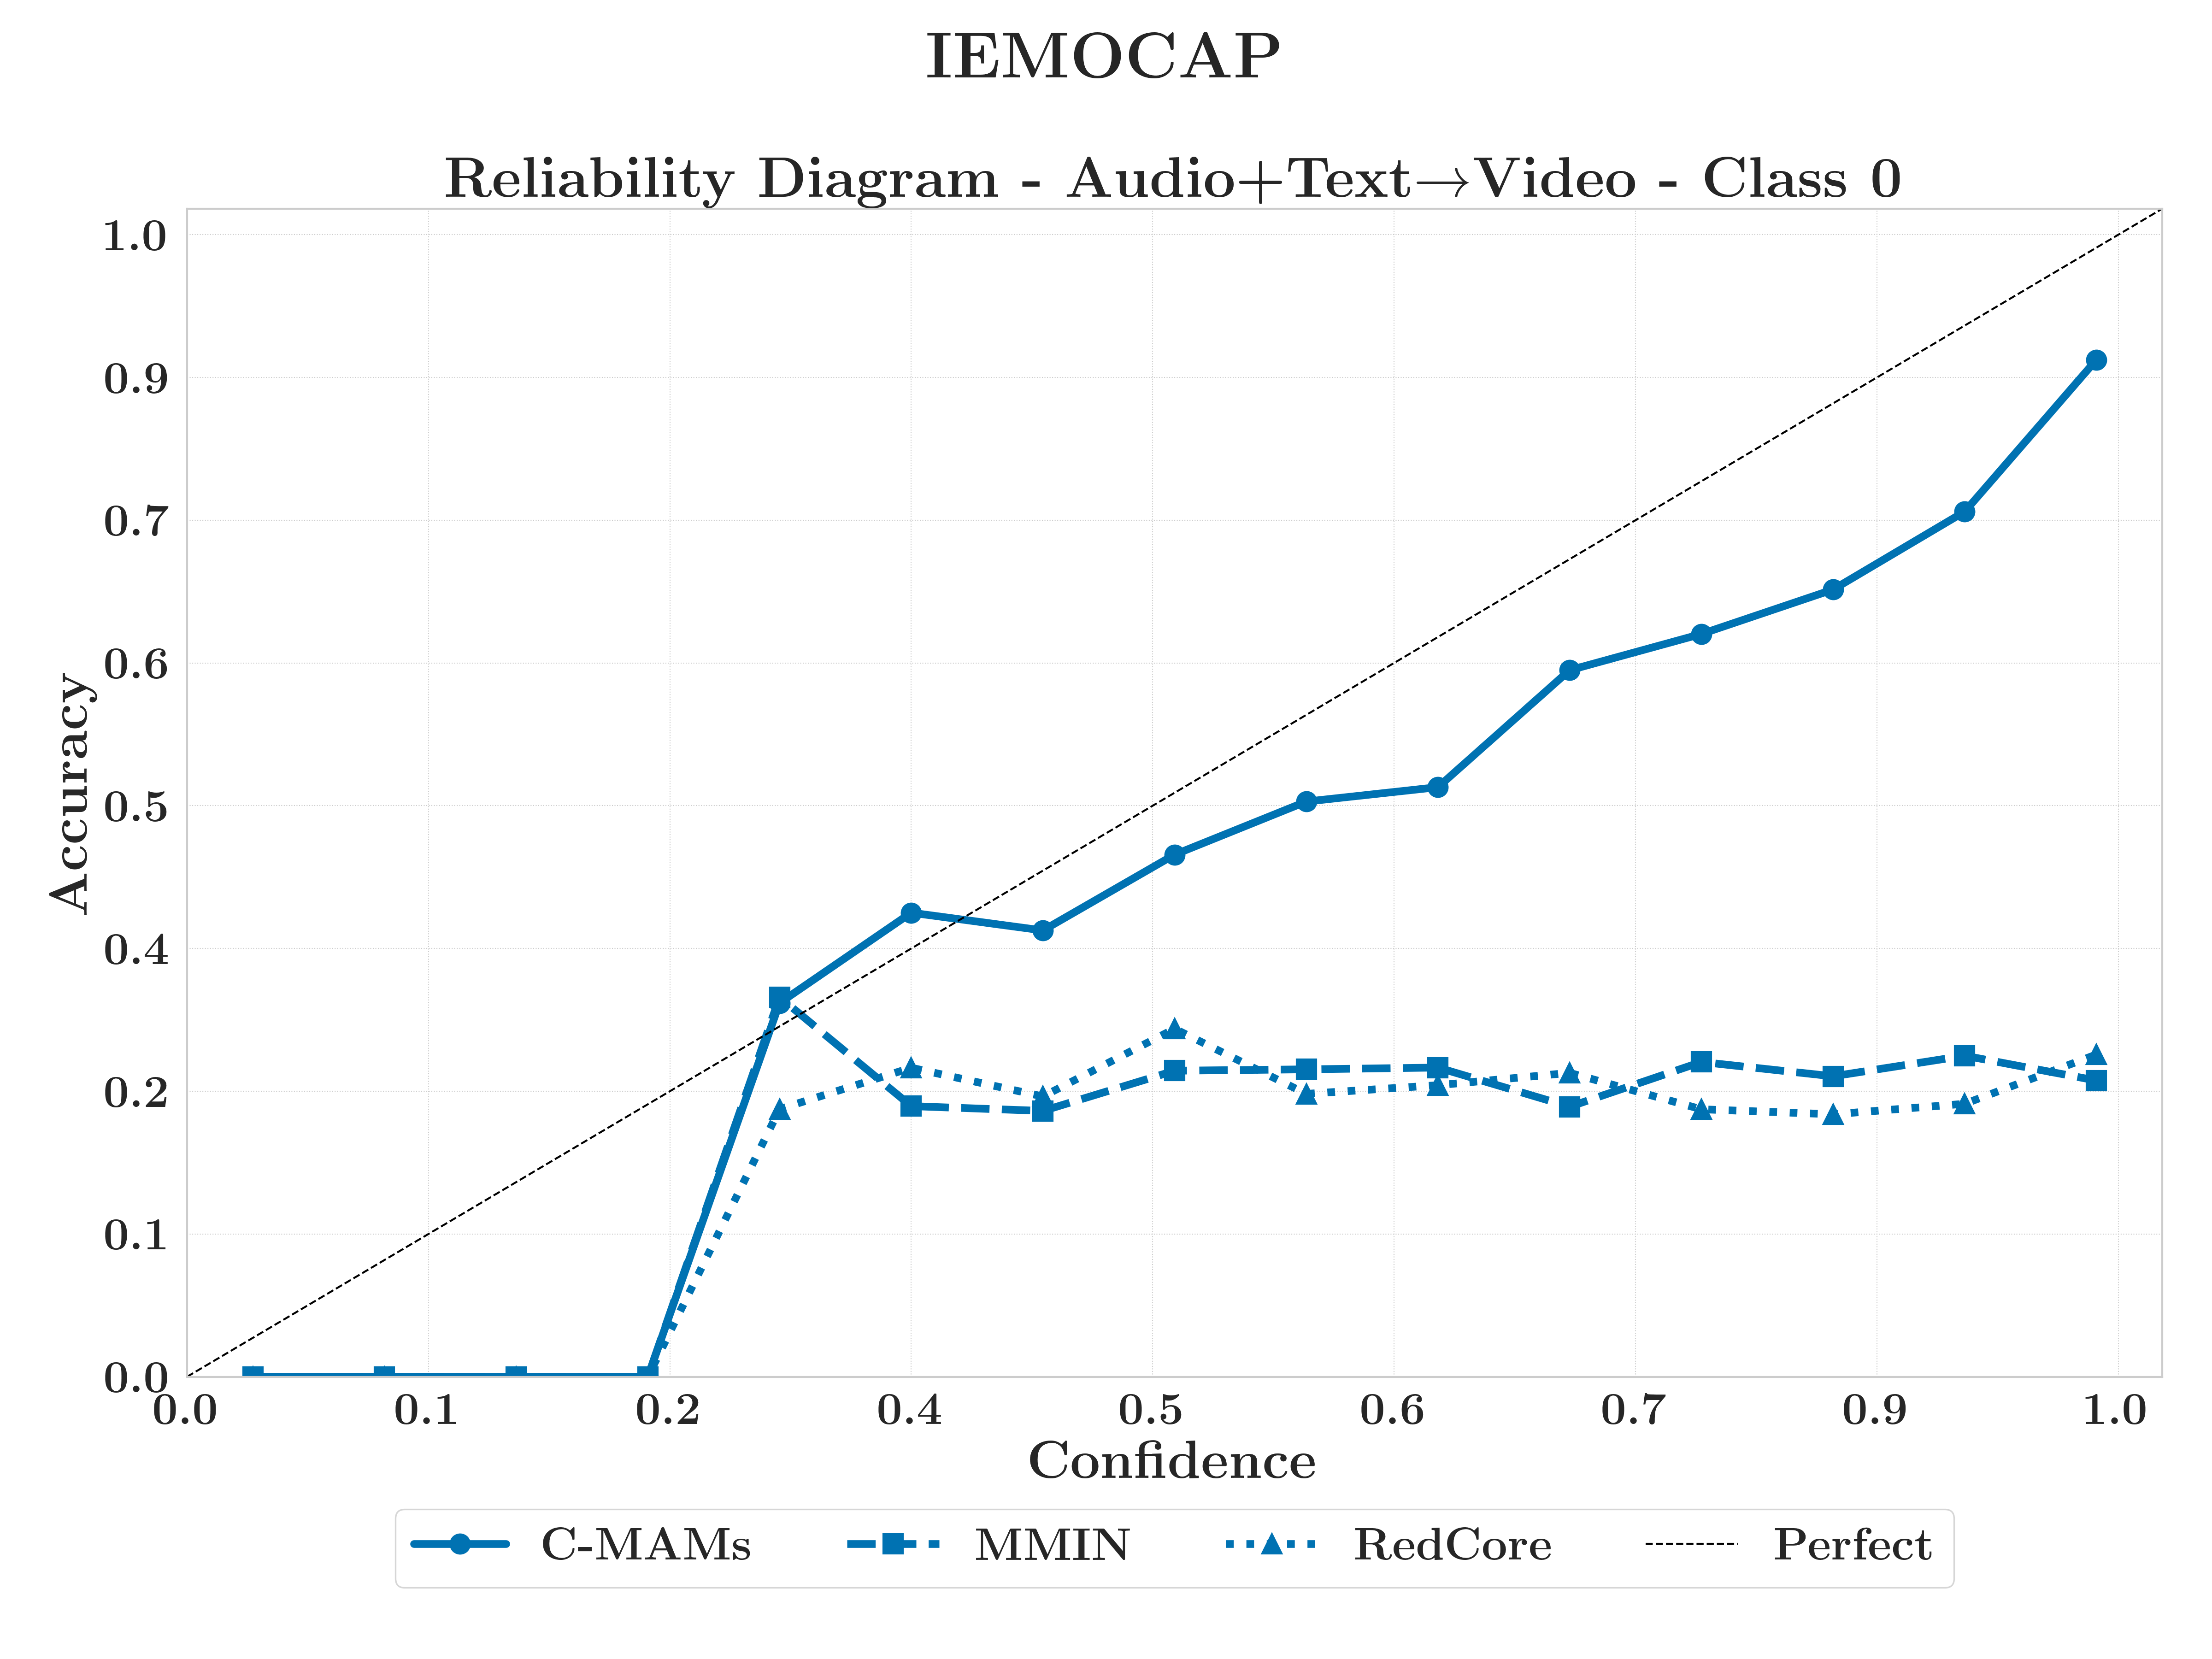
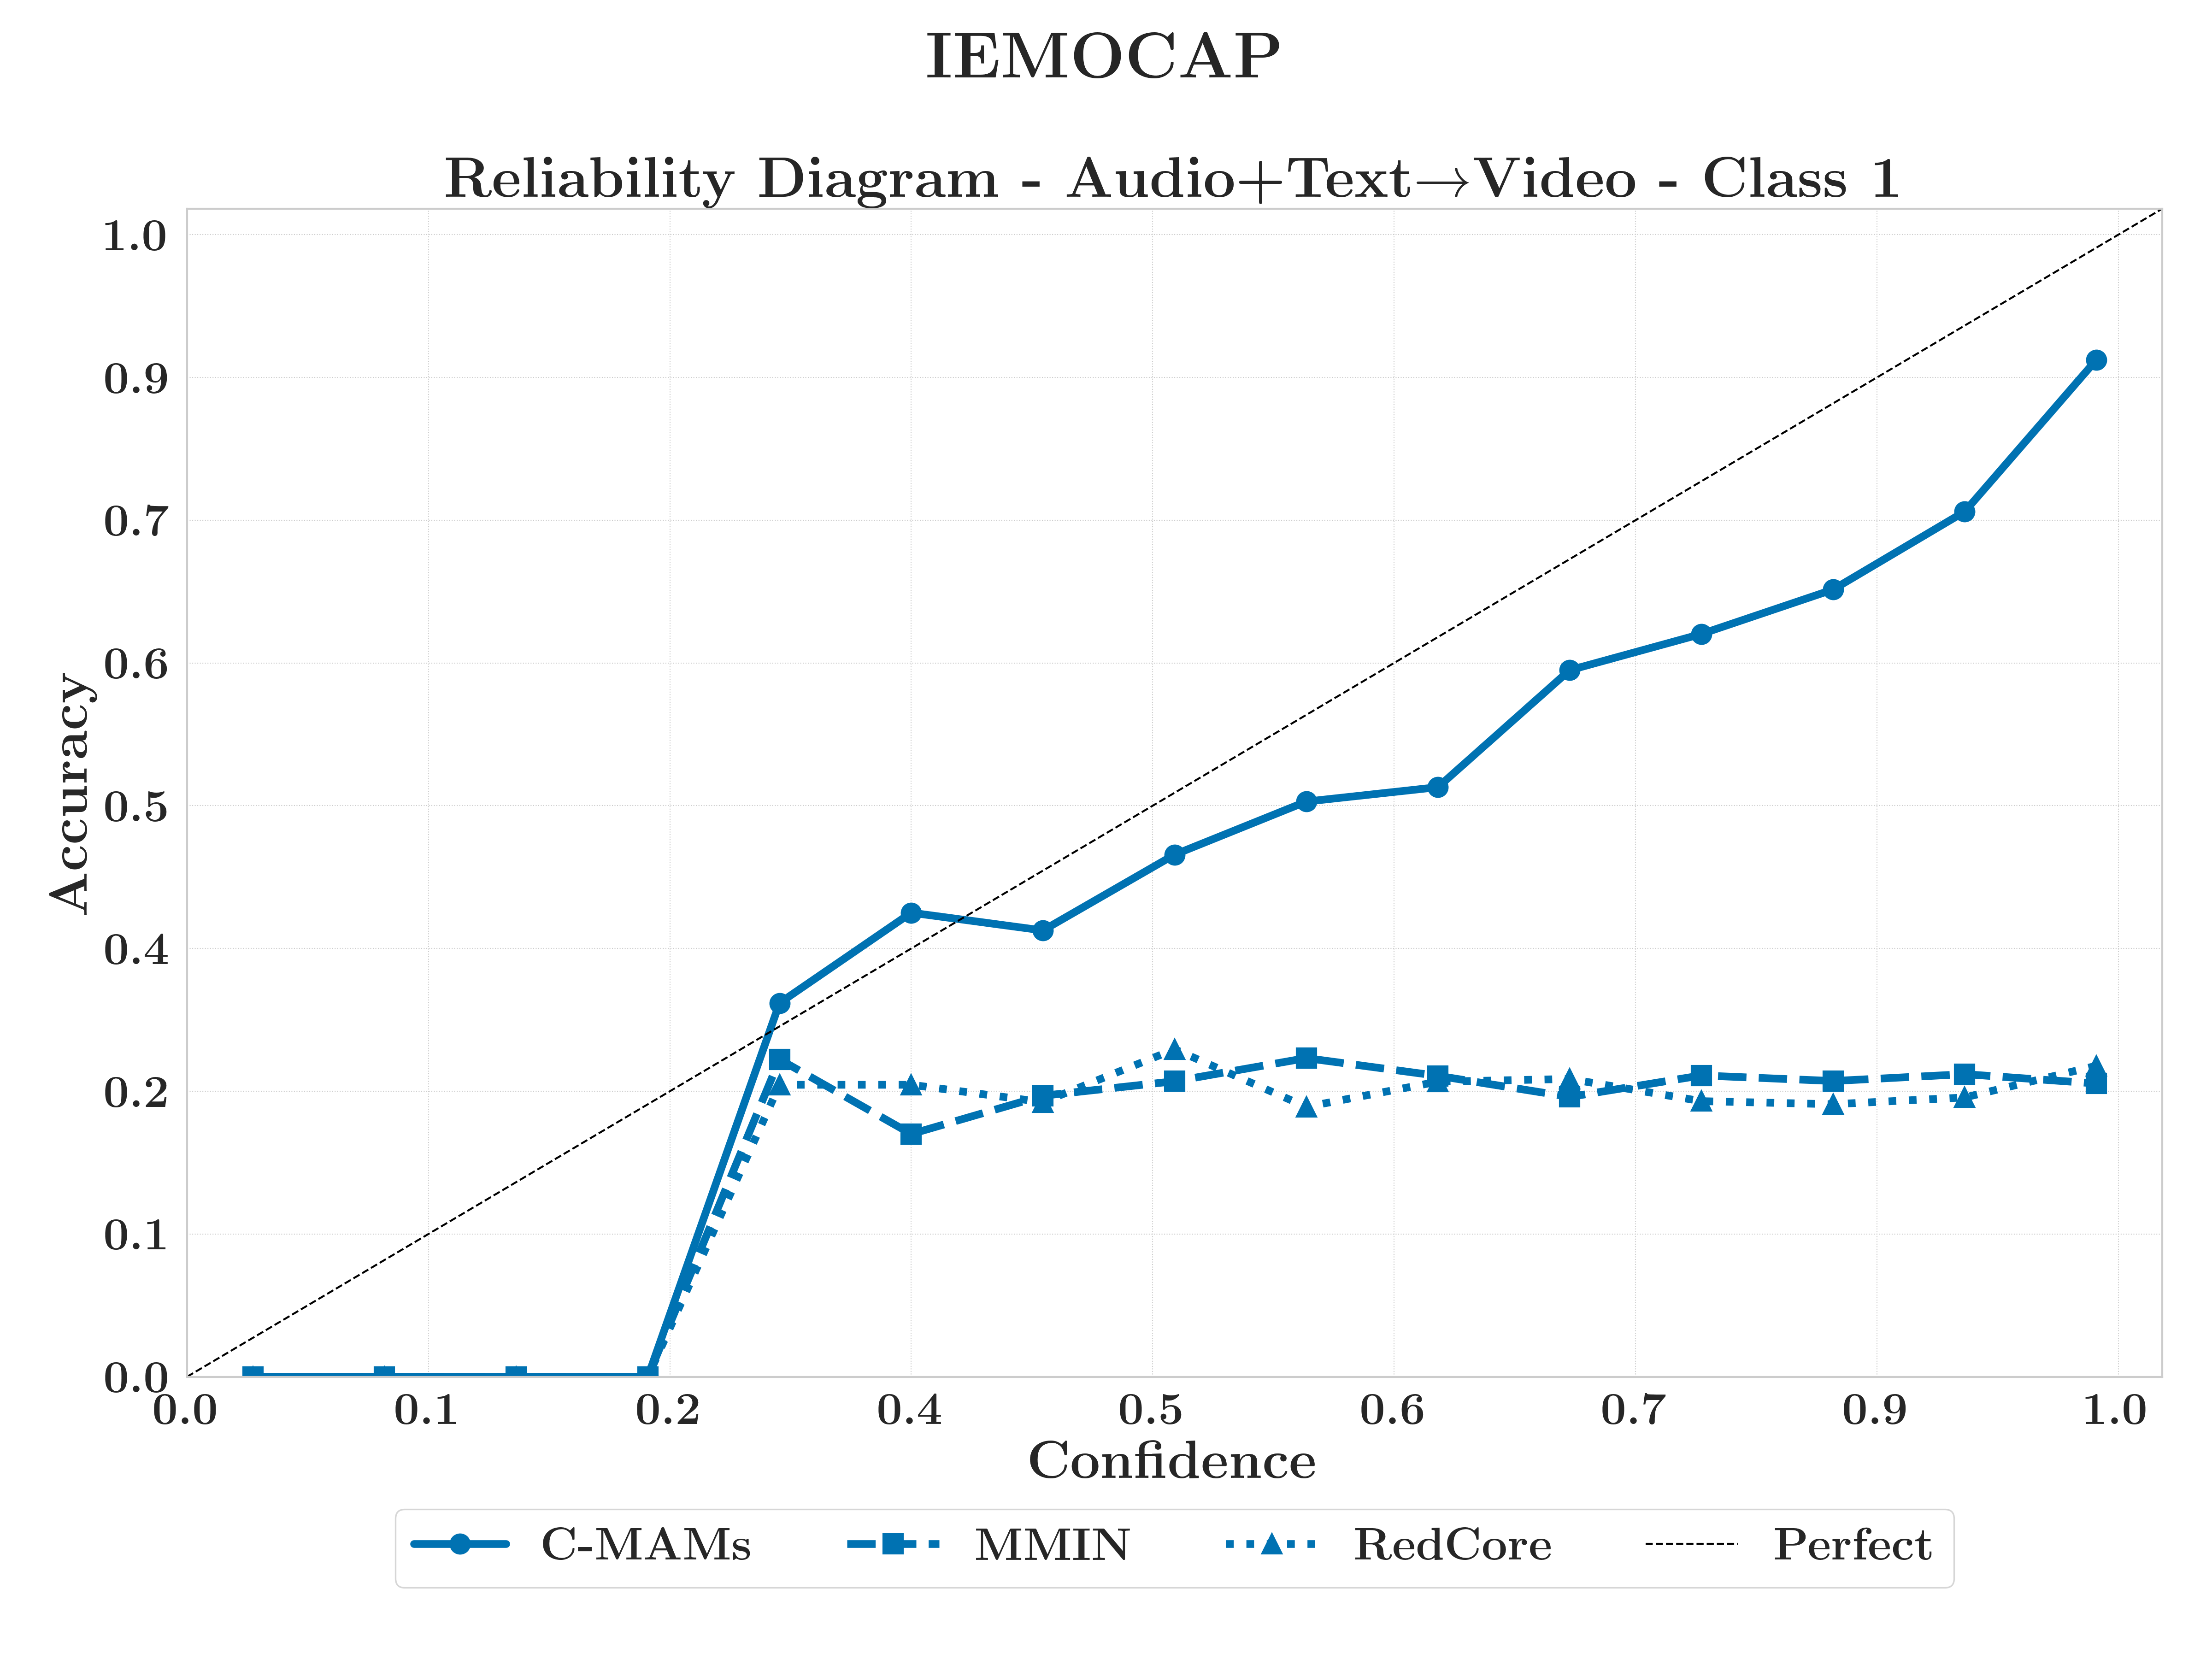
RQ3.3 — Class-specific behavioural biases
C-MAMs provide superior geometric fidelity and calibration compared to the overconfident behaviour of end-to-end baselines, which frequently achieve accuracy through distorted embeddings. This confirms that predictive accuracy and representational faithfulness are decoupled properties, not jointly guaranteed by model complexity.
CMU-MOSEIFidelity Leader
C-MAM dominates in both geometric fidelity and calibration, whereas RedCore induces substantial output distribution shifts and severe overconfidence.
MSP-IMPROVMixed Calibration
While C-MAM maintains geometric precision, MMIN and RedCore show better behavioural stability; RedCore surprisingly provides better calibration, likely due to its overparameterisation smoothing noisy signals.
IEMOCAPBest Calibration
C-MAM achieves the highest joint geometric-behavioural fidelity and decisive calibration advantages, with predictions closely tracing the diagonal while baselines deviate toward overconfidence.
What this shows
No reconstruction method eliminates class drift, but C-MAMs provide the highest geometric fidelity and, critically, the most reliable calibration.
RedCore and MMIN exhibit overconfidence, maintaining high confidence as correctness collapses.
Why it matters
Accuracy alone is not a sufficient measure of reconstruction quality.
Miscalibrated confidence under modality absence is a practical liability. C-MAMs ensure confidence remains an honest reflection of correctness.
RQ3 synthesis
RQ3 — Behavioural Fidelity of ReconstructionSynthesis
RQ3 synthesis
How do reconstructed modality embeddings affect the decision behaviour of multimodal models relative to missing-modality baselines, and how do different reconstruction methods compare in terms of information recovery, calibration behaviour, and class-conditional predictive structure?
Resolved Sub-Questions
RQ3.1
To what extent do reconstructed embeddings recover theoretically recoverable information?
Reconstructed embeddings substantially recover task-relevant information, but geometric similarity does not reliably predict how much behaviour is restored.
RQ3.2
How does reconstruction model complexity affect the generalisability of recovered predictive behaviour?
Lightweight decoders often outperform higher-capacity alternatives in behavioural stability; capacity does not guarantee fidelity.
RQ3.3
Do reconstructed embeddings induce class-specific behavioural biases across methods?
Yes: calibration benefits are clearest in bimodal reconstruction; unimodal conditions expose class-specific failures not visible in aggregate metrics.
Answer to RQ3Reconstruction architecture shapes decision behaviour beyond accuracy, with lightweight modular decoders like C-MAMs outperforming complex end-to-end alternatives in geometric fidelity and confidence calibration. Behavioural fidelity is not a function of model capacity but of encoder-decoder alignment; inductive simplicity generalises better and avoids the overfitting that plagues overparameterised approaches.
Transition
Centralised robustness holds.
Does it survive federated deployment?
RQ4 — Federated and Decentralised Reconstruction
RQ4 — Federated and Decentralised ReconstructionRQ4
Research question
Can modular reconstruction methods be adapted effectively for robust multimodal learning within incongruent federated systems with heterogeneous modality availability and local data access constraints?
Sub-questions
RQ4.1
Do modular C-MAMs improve global and client-level predictive performance when clients observe disjoint subsets of modalities?
RQ4.2
What are the communication and compute costs of deploying modular C-MAMs in federated multimodal systems?
Approach
Simulate federated settings with heterogeneous modality availability; train and distribute C-MAMs alongside a shared global model; evaluate global and client-level performance under modality incongruenceH1
Measure communication and computation costs of modular reconstruction; analyse behavioural variance and investigate selective aggregation effectsH2
RQ4.1
RQ4 — Federated and Decentralised ReconstructionRQ4.1 Results
RQ4.1 — C-MAMs in federated settings
FedC-MAMs restore substantial performance for modality-limited clients without destabilising global optimisation, but corrective benefit is strictly conditional on meaningful baseline degradation. Text-dominant configurations exhibit a ceiling effect where reconstruction offers negligible or detrimental returns.
CMU-MOSEISubstantial Recovery
FedC-MAMs substantially restored accuracy for modality-limited clients, with gains up to +0.47 in audio-only settings, while maintaining stability for text-dominant configurations.
MSP-IMPROVBoundary Case (AT)
Most groups experienced significant performance recovery, though the AT configuration emerged as a boundary case where reconstruction was detrimental due to low baseline degradation and conflicting gradients.
Client modalities
Base model
FedC-MAMs
Δ
A only
0.251
0.693
+0.442
V only
0.343
0.661
+0.318
AV
0.403
0.668
+0.265
T only
0.667
0.730
+0.063
AT
0.740
0.763
+0.023
TV
0.717
0.751
+0.034
Yellow: text-absent clients (A, V, AV), with gains statistically significant (Welch t > 30, p < 0.001). Text-containing clients: small, non-significant deltas.
FedC-MAMs restore substantial performance for modality-limited clients without destabilising the global model.
Gains are largest where local disadvantage is greatest, with a ceiling effect where available modalities are already highly informative.
Why it matters
Federated robustness does not require retraining the global backbone.
Local, modular reconstruction is sufficient to address client-level modality incongruence, validating modularity as a practical design principle for heterogeneous deployments.
RQ4.2
RQ4 — Federated and Decentralised ReconstructionRQ4.2 Results
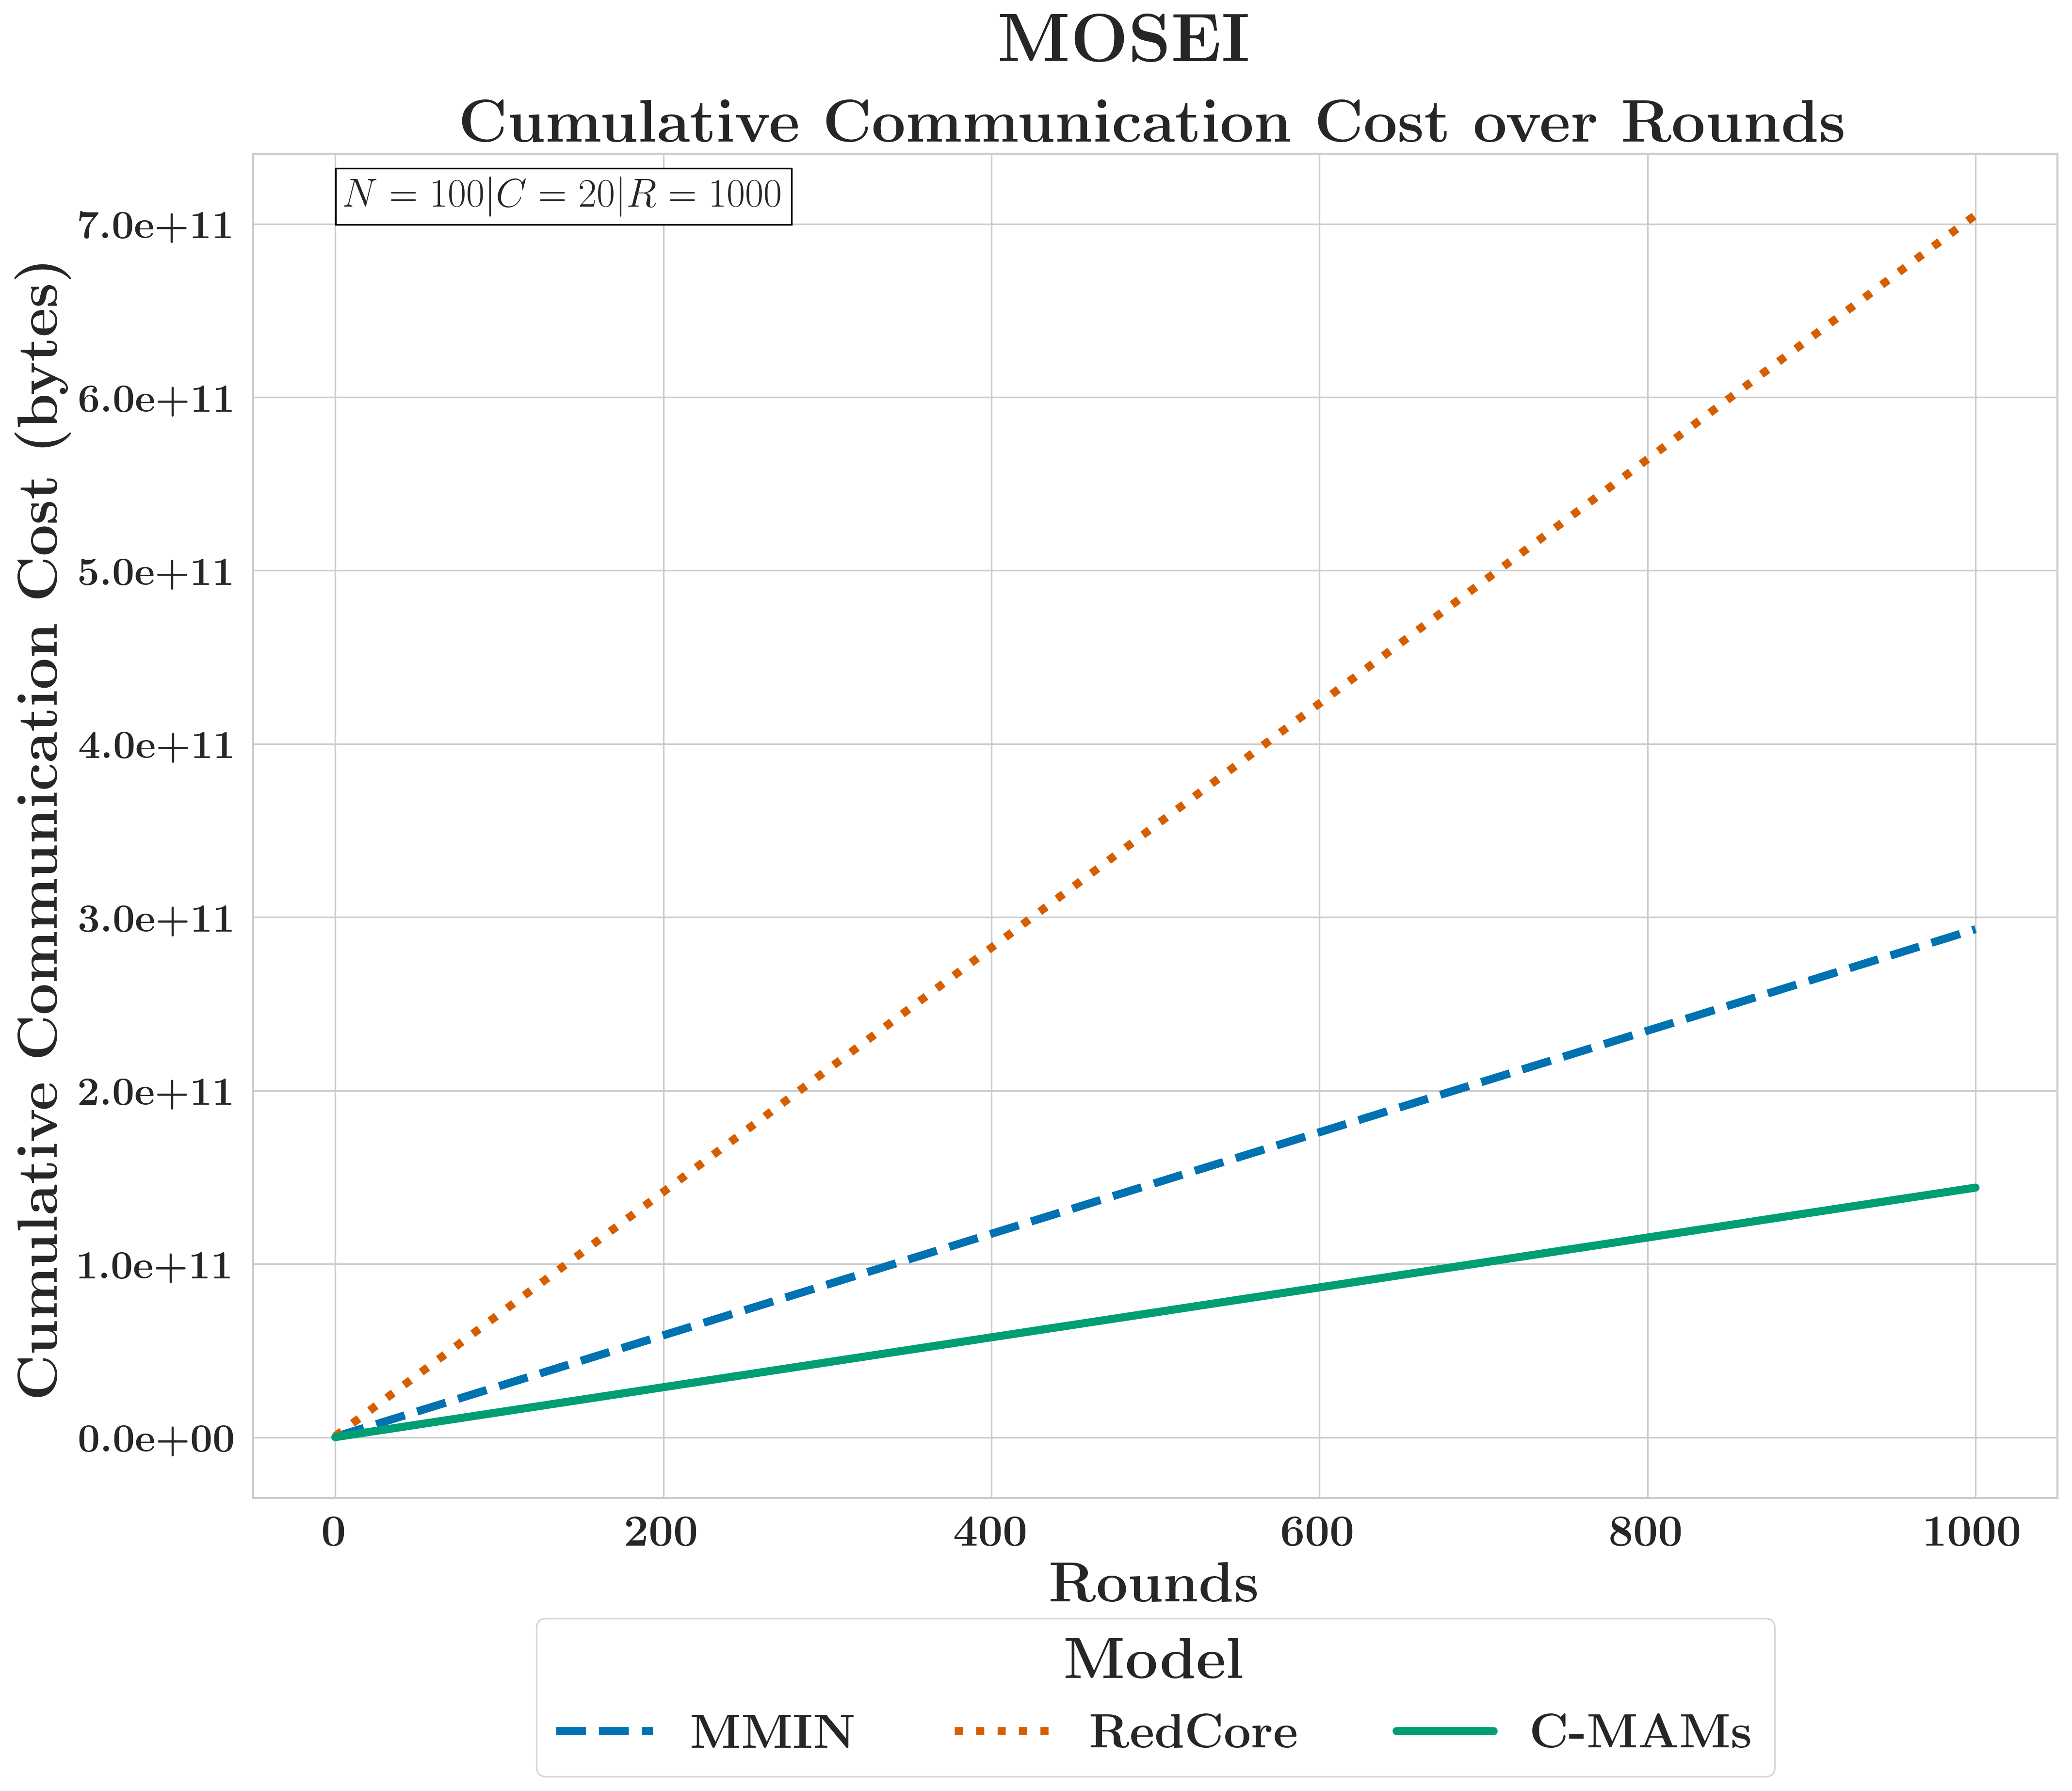
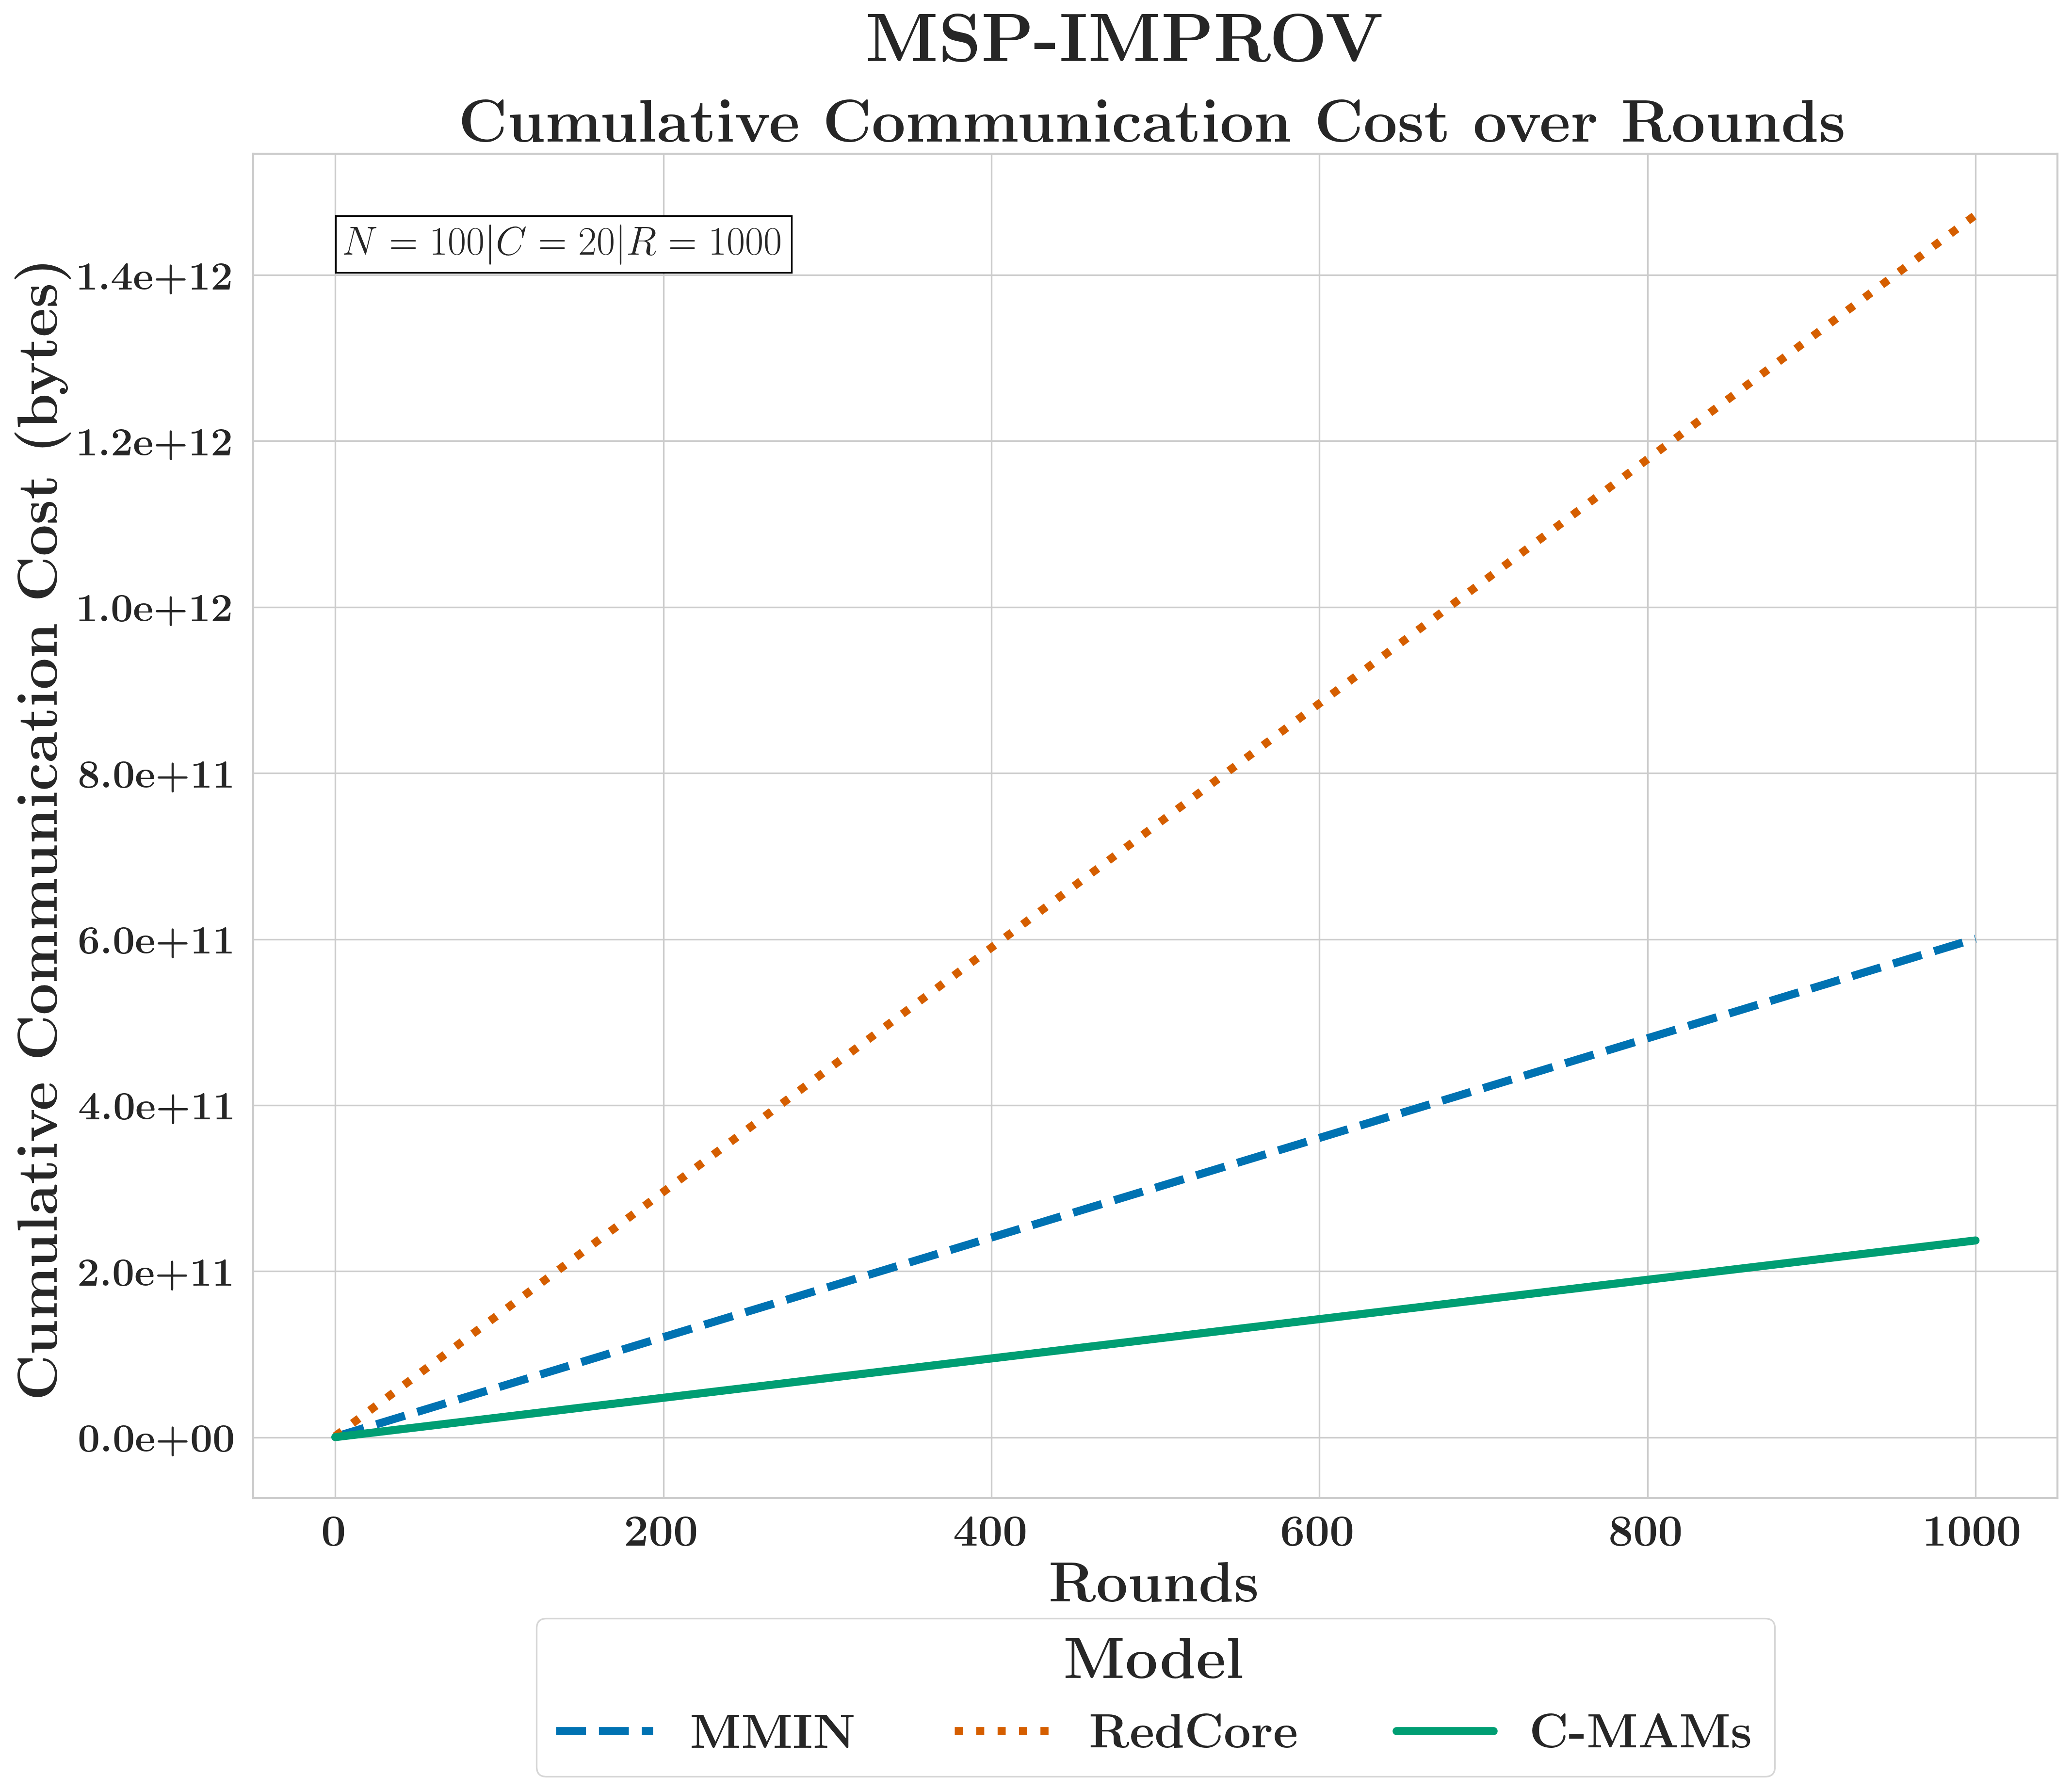
RQ4.2 — Communication and compute costs
FedC-MAMs use ~50% of MMIN's energy and ~20% of RedCore's at 1000 rounds. Clients transmit only the modules for their active modalities; cost scales with the client's modality set, not global model size.
CMU-MOSEI~50% vs MMIN
FedC-MAMs achieved a 50% reduction in cumulative communication volume and energy cost compared to mid-capacity monolithic models like MMIN.
MSP-IMPROV<17% vs RedCore
The efficiency gains were even more pronounced due to larger modality encoders, with FedC-MAMs consuming less than 17% of the energy required by high-capacity transformer baselines.
FedC-MAMs transmit only the parameters relevant to a client's active modalities, reducing cumulative communication and energy costs by ~50% against MMIN and over 75% against RedCore across 1,000 training rounds.
Why it matters
Bandwidth and energy constraints are the binding limitation for federated edge deployments.
Modularity resolves this. Robustness and communication efficiency are not a trade-off, they are achieved together.
RQ4 synthesis
RQ4 — Federated and Decentralised ReconstructionSynthesis
RQ4 synthesis
Can modular reconstruction methods be adapted effectively for robust multimodal learning within incongruent federated systems with heterogeneous modality availability and local data access constraints?
Resolved Sub-Questions
RQ4.1
Do modular C-MAMs improve global and client-level predictive performance when clients observe disjoint subsets of modalities?
Yes, where the baseline degrades: audio-only, video-only, and audio-video clients gain substantially; text-dominant clients see minimal or negligible gains; negative impact is limited to configurations where unimodal dominance is already near-ceiling (e.g. MSP-IMPROV AT).
RQ4.2
What are the communication and compute costs of deploying modular C-MAMs in federated multimodal systems?
FedC-MAMs transmit only client-relevant modules, achieving substantially lower cumulative communication cost than MMIN or RedCore; local compute overhead is bounded and independent of global model size.
Answer to RQ4Modular reconstruction adapts effectively to federated settings, with FedC-MAMs restoring performance for modality-limited clients via selective parameter aggregation without destabilising global optimisation.
Corrective capacity is contingent on meaningful baseline degradation, but the framework offers a scalable path to robust multimodal learning in heterogeneous, resource-constrained environments.
Thesis Synthesis
Thesis — Final SynthesisConclusion
Thesis claim
Missing-modality robustness is a behavioural, architectural, and systems-level design challenge that can be mitigated post-training through modular reconstruction without retraining or architectural modification.
Research Questions — Resolved
RQ1
How and to what extent does model performance change when an entire modality is unavailable, and how reliably can this be anticipated?
Degradation is substantial, asymmetric, and partially predictable; attribution signals do not reliably reflect functional dependence, and modality reliance emerges early in training.
RQ2
To what extent can modular post-training reconstruction mitigate missing-modality performance degradation?
C-MAMs recover a substantial fraction of lost performance with shallow networks on limited data; recovery correlates with inter-modality structure, not reconstruction geometry.
RQ3
How do reconstructed embeddings affect model behaviour, and how do methods compare in fidelity and calibration?
Reconstruction improves behaviour but geometric fidelity and calibration diverge systematically; lightweight decoders can achieve stronger behavioural stability than high-capacity alternatives.
RQ4
Can modular reconstruction be adapted for federated systems with heterogeneous modality availability?
FedC-MAMs improve client-level robustness where degradation is meaningful and reduce communication cost relative to monolithic baselines; they are scalable and behaviourally effective.
Thesis conclusionPractical robustness to missing modalities can be achieved through simple, modular, post-training reconstruction that respects deployed architectures and scales naturally across centralised and decentralised environments.
Looking Back and Looking Forward
Thesis — RetrospectiveLimitations & Future Work
Looking Back
There is always something more that could have been done
Controlled conditions only
Analysis targets complete modality absence at inference. Partial degradation, intermittency, and temporal failure are distinct problems outside the intended scope.
Embedding-level reconstruction only
Reconstruction operates on learned representations, not raw signals. Claims do not extend to audio synthesis, image generation, or other generative modality recovery.
No temporal modelling
Prediction is made from a single multimodal instance. Sequential, streaming, and event-driven settings introduce qualitatively different failure modes.
Empirical regularities, not formal guarantees
Behavioural fidelity is established empirically under controlled conditions. Formal error bounds and decision-theoretic guarantees remain open problems.
Federated proof-of-concept
FedC-MAM experiments use fixed client sets, IID partitions, and FedAvg. Non-IID drift, client churn, and richer aggregation strategies are not addressed.
Looking Forward
There is always something more to do
Trustworthiness of reconstructed representations
Under what conditions should inferred embeddings support decision-making? Reconstruction must be integrated with reliability and failure-mode assessment, not treated as a standalone robustness tool.
Privacy & security under reconstruction
Effective reconstruction may recover sensitive attributes never explicitly shared. Robustness and privacy guarantees must be studied jointly in decentralised multimodal systems.
Behavioural evaluation as standard practice
Accuracy and geometric similarity are insufficient. Evaluation protocols must specify calibration, confidence, and class-conditional criteria before reconstruction methods are deployed.
Representations designed for reconstructability
Robustness is constrained by the structure of learned embeddings, not decoder capacity. Cross-modal substitutability must become an explicit representation learning objective, not an implicit by-product of fusion.
Federated robustness as a coupled systems problem
Reconstruction, aggregation dynamics, privacy leakage, and client heterogeneity interact. Longitudinal evaluation and integration with privacy-preserving techniques are necessary next steps.
Multimodal learning is promised as the better approach, more context, more robustness. Making that promise real is hard work. This thesis, I hope, brings us one step closer to that ideal.
Thank You
Thank you
Publications
PublicationsAppendix
PhD Related
Directly related to the work presented in this thesis
ECAI — MRC Workshop (2023)
Geraghty, Hines & Golpayegani. "Understanding the Relevancy of Modality Information in Multimodal Machine Learning". In: Modelling and Representing Context (MRC), ECAI.
Interpreting the Behaviour of Reconstructed Modalities
Under Review
Journal paper — details to be confirmed
Behavioural Failures in Multimodal Models Under Missing Modalities
Under Review
Journal paper — details to be confirmed
Non-PhD Related
Not directly related to the work presented in this thesis
ACM MMSys (2022)
Geraghty et al. "AQP: an open modular Python platform for objective speech and audio quality metrics". In: Proc. 13th ACM Multimedia Systems Conference, pp. 191–196. DOI: 10.1145/3524273.3532885
IEEE Access — Journal (2022)
Golpayegani et al. "Intelligent Shared Mobility Systems: A Survey on Whole System Design Requirements, Challenges and Future Direction". In: IEEE Access 10, pp. 35302–35320. DOI: 10.1109/ACCESS.2022.3162848
Springer Book Chapter (2026)
Geraghty et al. "Traffic Flow Breakdown Prediction for the M50 Motorway in Ireland". In: Transport Transitions: Advancing Sustainable and Inclusive Mobility. Springer Nature Switzerland, pp. 514–520.
ACM MMSys (2026)
Geraghty, Golpayegani & Hines. "Audio Made Simple: A Modern Framework for Audio Processing". In: Proc. ACM Multimedia Systems Conference 2026, pp. 436–442. DOI: 10.1145/3793853.3799811